
By: Sebastien Lozano & Matthew Toro
We recently posted on bicycle crashes in Miami-Dade County. Today we give you county pedestrian crashes.
Car-on-walker crashes were mapped using the same method used for mapping bike crashes. In this case, though, we looked into the Florida Department of Transportation (FDOT) Safety Office’s comprehensive crash data and extracted the location of crashes involving at least one pedestrian and one motor vehicle. (And, yes, according to FDOT, just like bicyclists, pedestrians are also known as “vulnerable road users”.)
We analyzed the density of pedestrian crashes from 2005 to 2013, and created nine heat maps (animated below) to illustrate the intensity of the crashes throughout these years.
Each crash is represented by a small, blue point. As the colors surrounding the crash point change, so change the density of the crashes. Densities increase as the colors change from cool to warm.
As with the bicycle crash heat maps, the color ramps associated with each year of crash data are relative to the density of crashes for each year, exclusive of the crash density for previous or later years. The ‘heat’ depicted in each map is quantitatively and cartographically unrelated to that depicted in the other maps.

Miami-Dade Pedestrian Crashes, 2005. Data Source: FDOT Safety Office. Map Source: Sebastien Lozano & Matthew Toro. 2015.

Miami-Dade Pedestrian Crashes, 2006. Data Source: FDOT Safety Office. Map Source: Sebastien Lozano & Matthew Toro. 2015.

Miami-Dade Pedestrian Crashes, 2007. Data Source: FDOT Safety Office. Map Source: Sebastien Lozano & Matthew Toro. 2015.

Miami-Dade Pedestrian Crashes, 2008. Data Source: FDOT Safety Office. Map Source: Sebastien Lozano & Matthew Toro. 2015.

Miami-Dade Pedestrian Crashes, 2009. Data Source: FDOT Safety Office. Map Source: Sebastien Lozano & Matthew Toro. 2015.
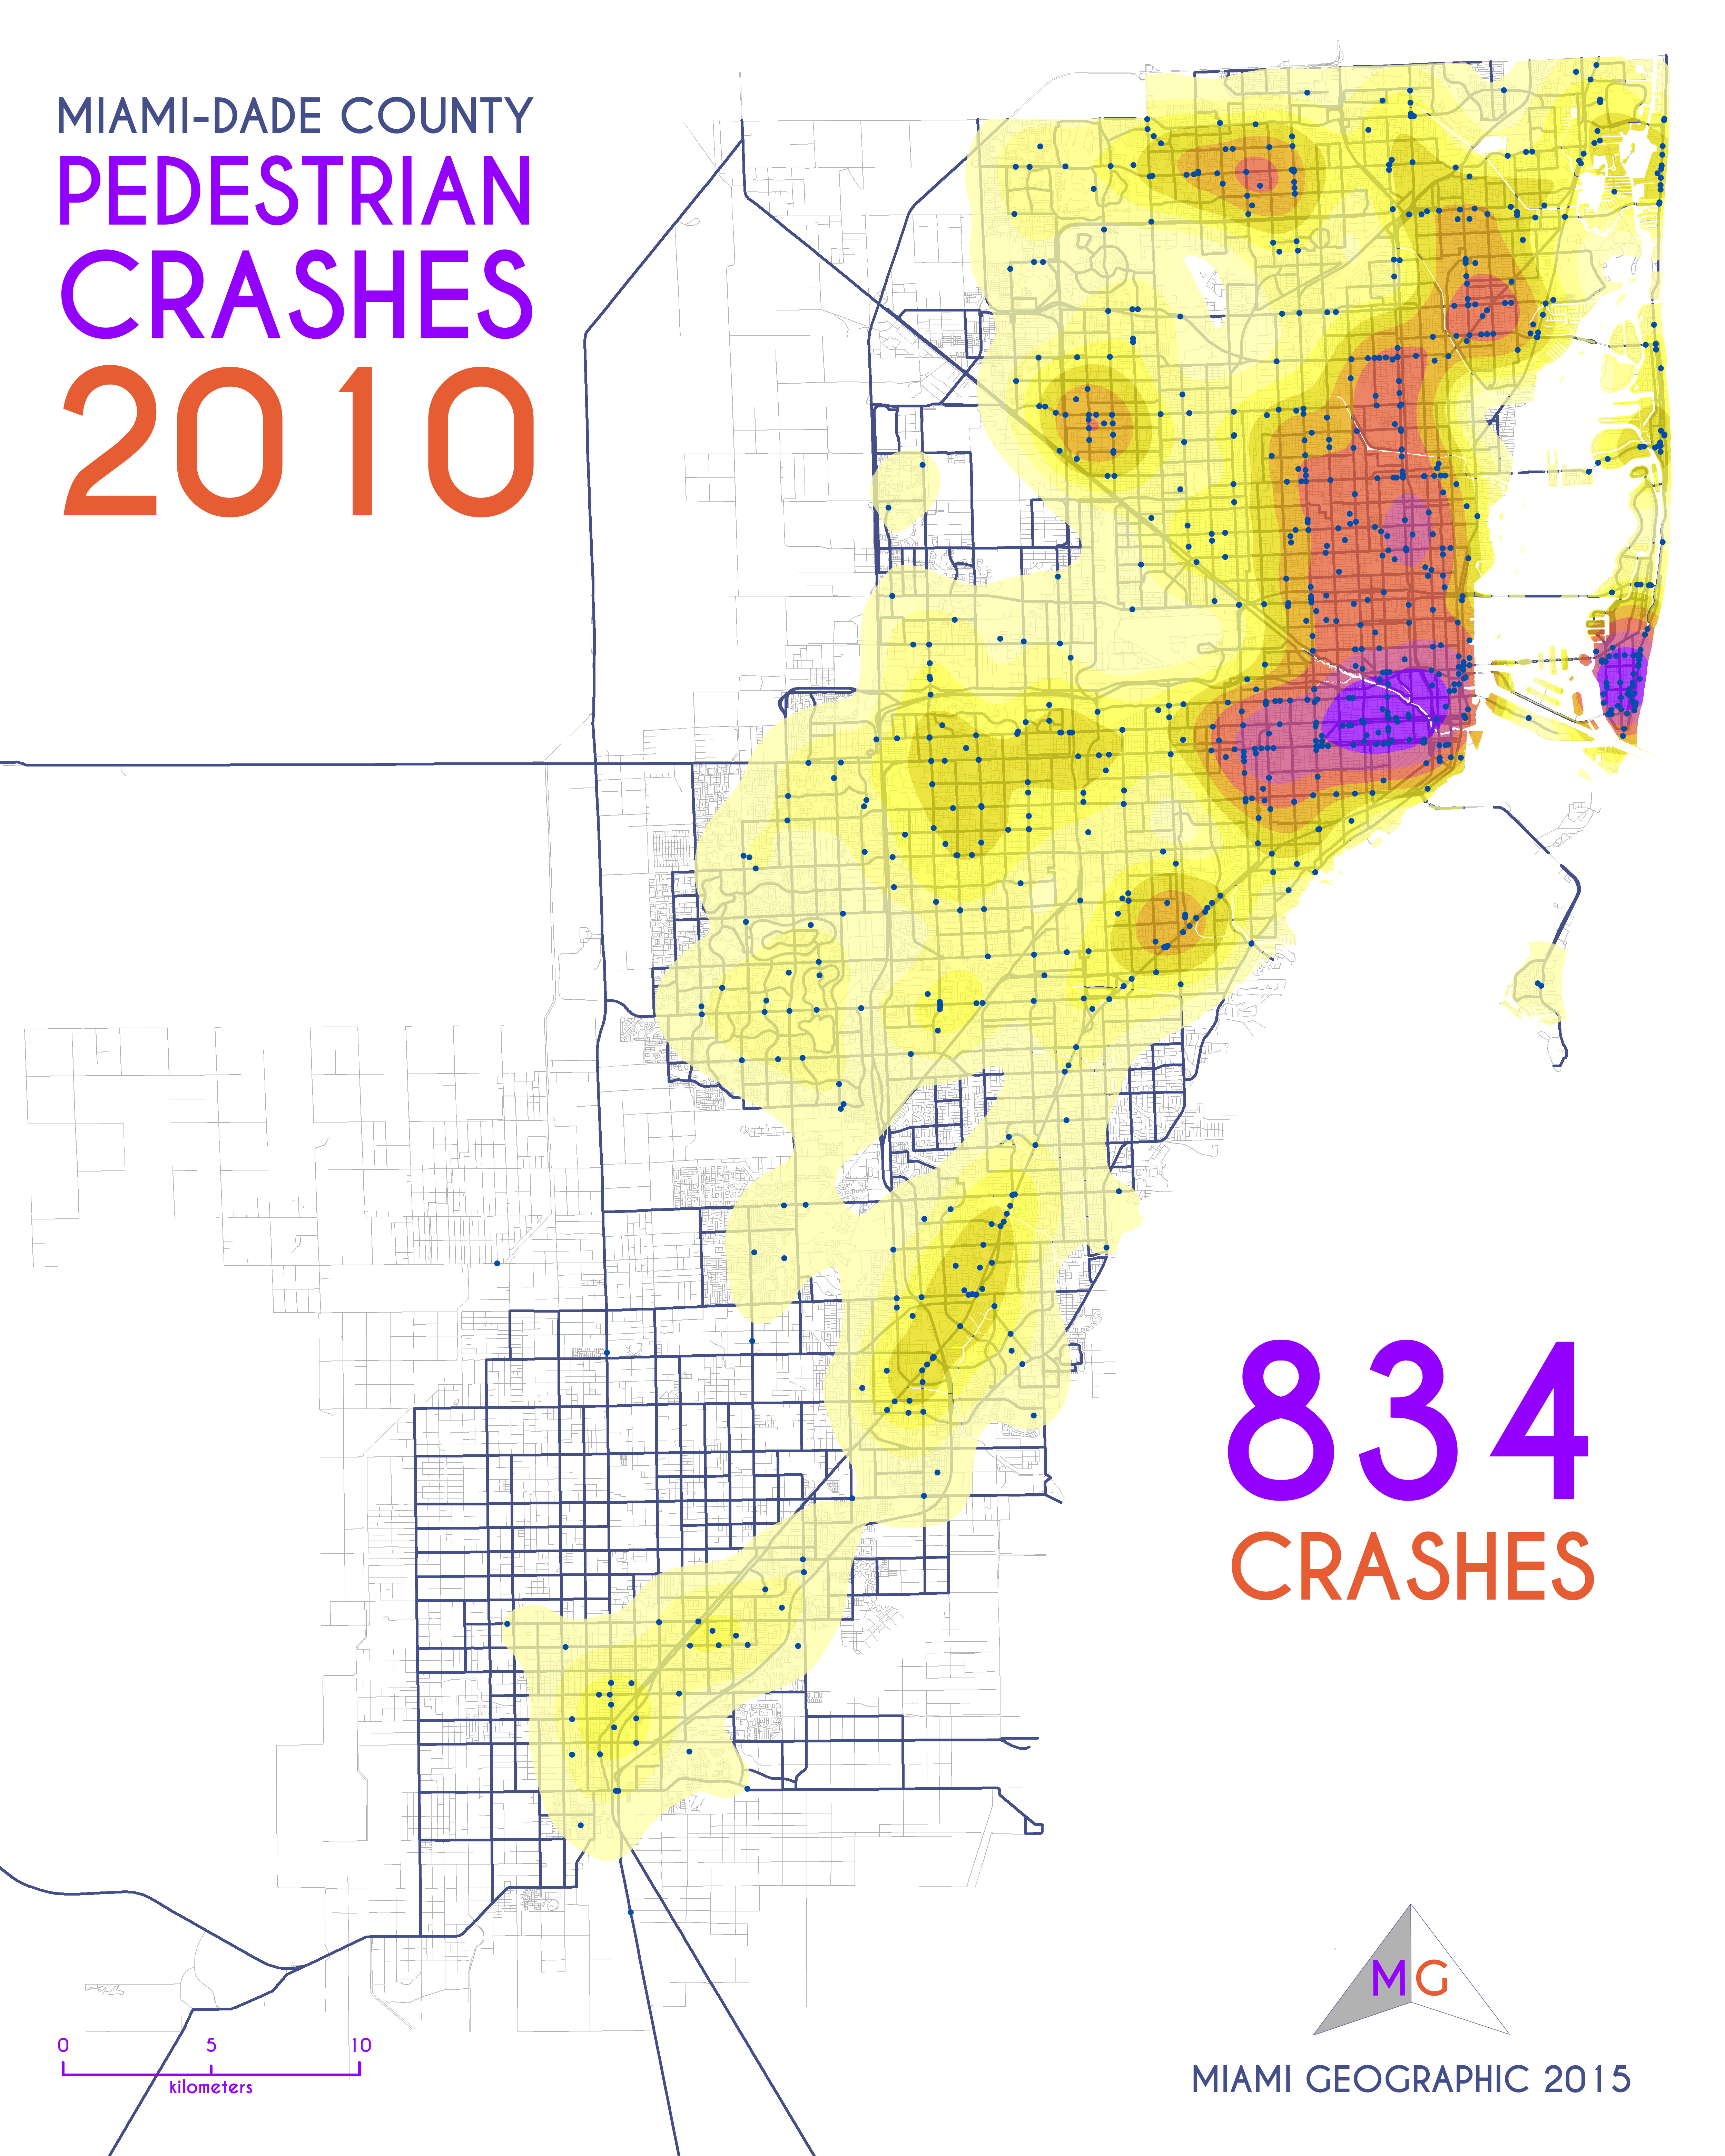
Miami-Dade Pedestrian Crashes, 2010. Data Source: FDOT Safety Office. Map Source: Sebastien Lozano & Matthew Toro. 2015.

Miami-Dade Pedestrian Crashes, 2011. Data Source: FDOT Safety Office. Map Source: Sebastien Lozano & Matthew Toro. 2015.

Miami-Dade Pedestrian Crashes, 2012. Data Source: FDOT Safety Office. Map Source: Sebastien Lozano & Matthew Toro. 2015.

Miami-Dade Pedestrian Crashes, 2013. Data Source: FDOT Safety Office. Map Source: Sebastien Lozano & Matthew Toro. 2015.
The areas most impacted by automobile-on-pedestrian crashes are generally the same areas affected by automobile-on-bicycle collisions. Again, Miami Beach is where crashes are densest, as well as in the City of Miami. Inner-city neighborhoods such as Little Havana, Overtown, Brickell, and downtown have the highest number and intensity of crashes.
Unlike bicycle crashes in Miami-Dade County (which have nearly doubled from 2005 to 2013), the total number of pedestrian crashes has decreased over the nine-year period analyzed. From 921 in 2005, the total number of crashes fell to 786 in 2013 — a 14.7% decrease. According to these FDOT data, that means there has been a near one-sixth decrease in cars hitting pedestrians in Miami since 2005. (See graph below.)

Miami-Dade County Pedestrian Crashes — Line Graph, 2005-2013. Data Source: FDOT Safety Office. Graph Source: Sebastien Lozano & Matthew Toro. 2015.
This 15% decrease is likely the result of multiple gradual changes to not only the built environment, but also in the collective mentality of those moving through it, the socio-cultural environment, if you will.
Bear in mind, though, that, despite this admirable decrease over the last decade or so, Miami remains the fourth most dangerous metropolitan region in the United States, according to Smart Growth America’s May 2014 “Dangerous By Design” report. Worth noting is that the top (worst) four metro regions on the list are all in Florida: Orlando, Tampa, Jacksonville, and Miami, respectively. FDOT seems to have its work cut out for it.
Improvements in pedestrian facilities (e.g., sidewalks, crosswalks, crossing signals, etc.) have certainly helped, but Miami has a long way to go in terms of engineering and educating its way out of the public safety crisis on its roadways.

Miami-Dade Pedestrian Crashes, Animated, 2005-2013. Data Source: FDOT Safety Office. Graph Source: Sebastien Lozano & Matthew Toro. 2015.
METHODS:
As with the bicycle crash analysis, the results of this pedestrian crash analysis depend on the quality of the data available through FDOT’s Safety Office. It is possible, and probable, that many bicycle and pedestrian crash occurrences never make it to the final datasets.
This could be due to several possible causes. In some instances, police and/or other public safety officials deliberately opt not to report such crashes. In other cases, the biker or walker simply opt not to wait for a formal report to be written. Hit-and-run instances are likely common too. Our analysis, as with all analyses, is limited by the quality of our data.
The pedestrian crash heat maps above were produced using a kernel density function — cell size = 12 meters; search radius = 3000 meters. This function calculates a ‘smoothed’ surface of density values based on the concentration of points throughout the area analyzed, in this case, Miami-Dade County, Florida.

I’m not thrilled about the term “Pedestrian Crashes” because it insinuates the victims as the perpetrators. What about something more neutral, such as “Pedestrian-Involved Crashes”? That’s a bit wordy, but you get my drift? 🙂
I agree. Miami’s roads and streets are already unfairly divided. Might as well have a language that is more democratic.
Interesting but impossible to solve any issues without identifying the qualitative variables that influence the quantities. This is about human behavior after all.
Good point, Angel.