
It’s hard to deny it: Miami is a microcosm of the Latinization of the United States.

But Latins aren’t all the same, and we don’t necessarily settle together in the same pockets of the metro area.
Looking at los latinos en Miami-Dade in maps, we find some interesting spatial distributions of Latin nationalities.
Indeed, more often than not, we see a certain degree of clustering among particular groups.
In some cases, we see full-fledged ethno-national enclaves.
Let’s go through the list alphabetically. These maps used 2010 decennial data from the US Census Bureau.
Argentines
For the most part, Argentines prefer the islands, especially those in the northeast, although a lot of South Americans flock to downtown and the western edge of the metro too. Doral is always popular with South Americans.
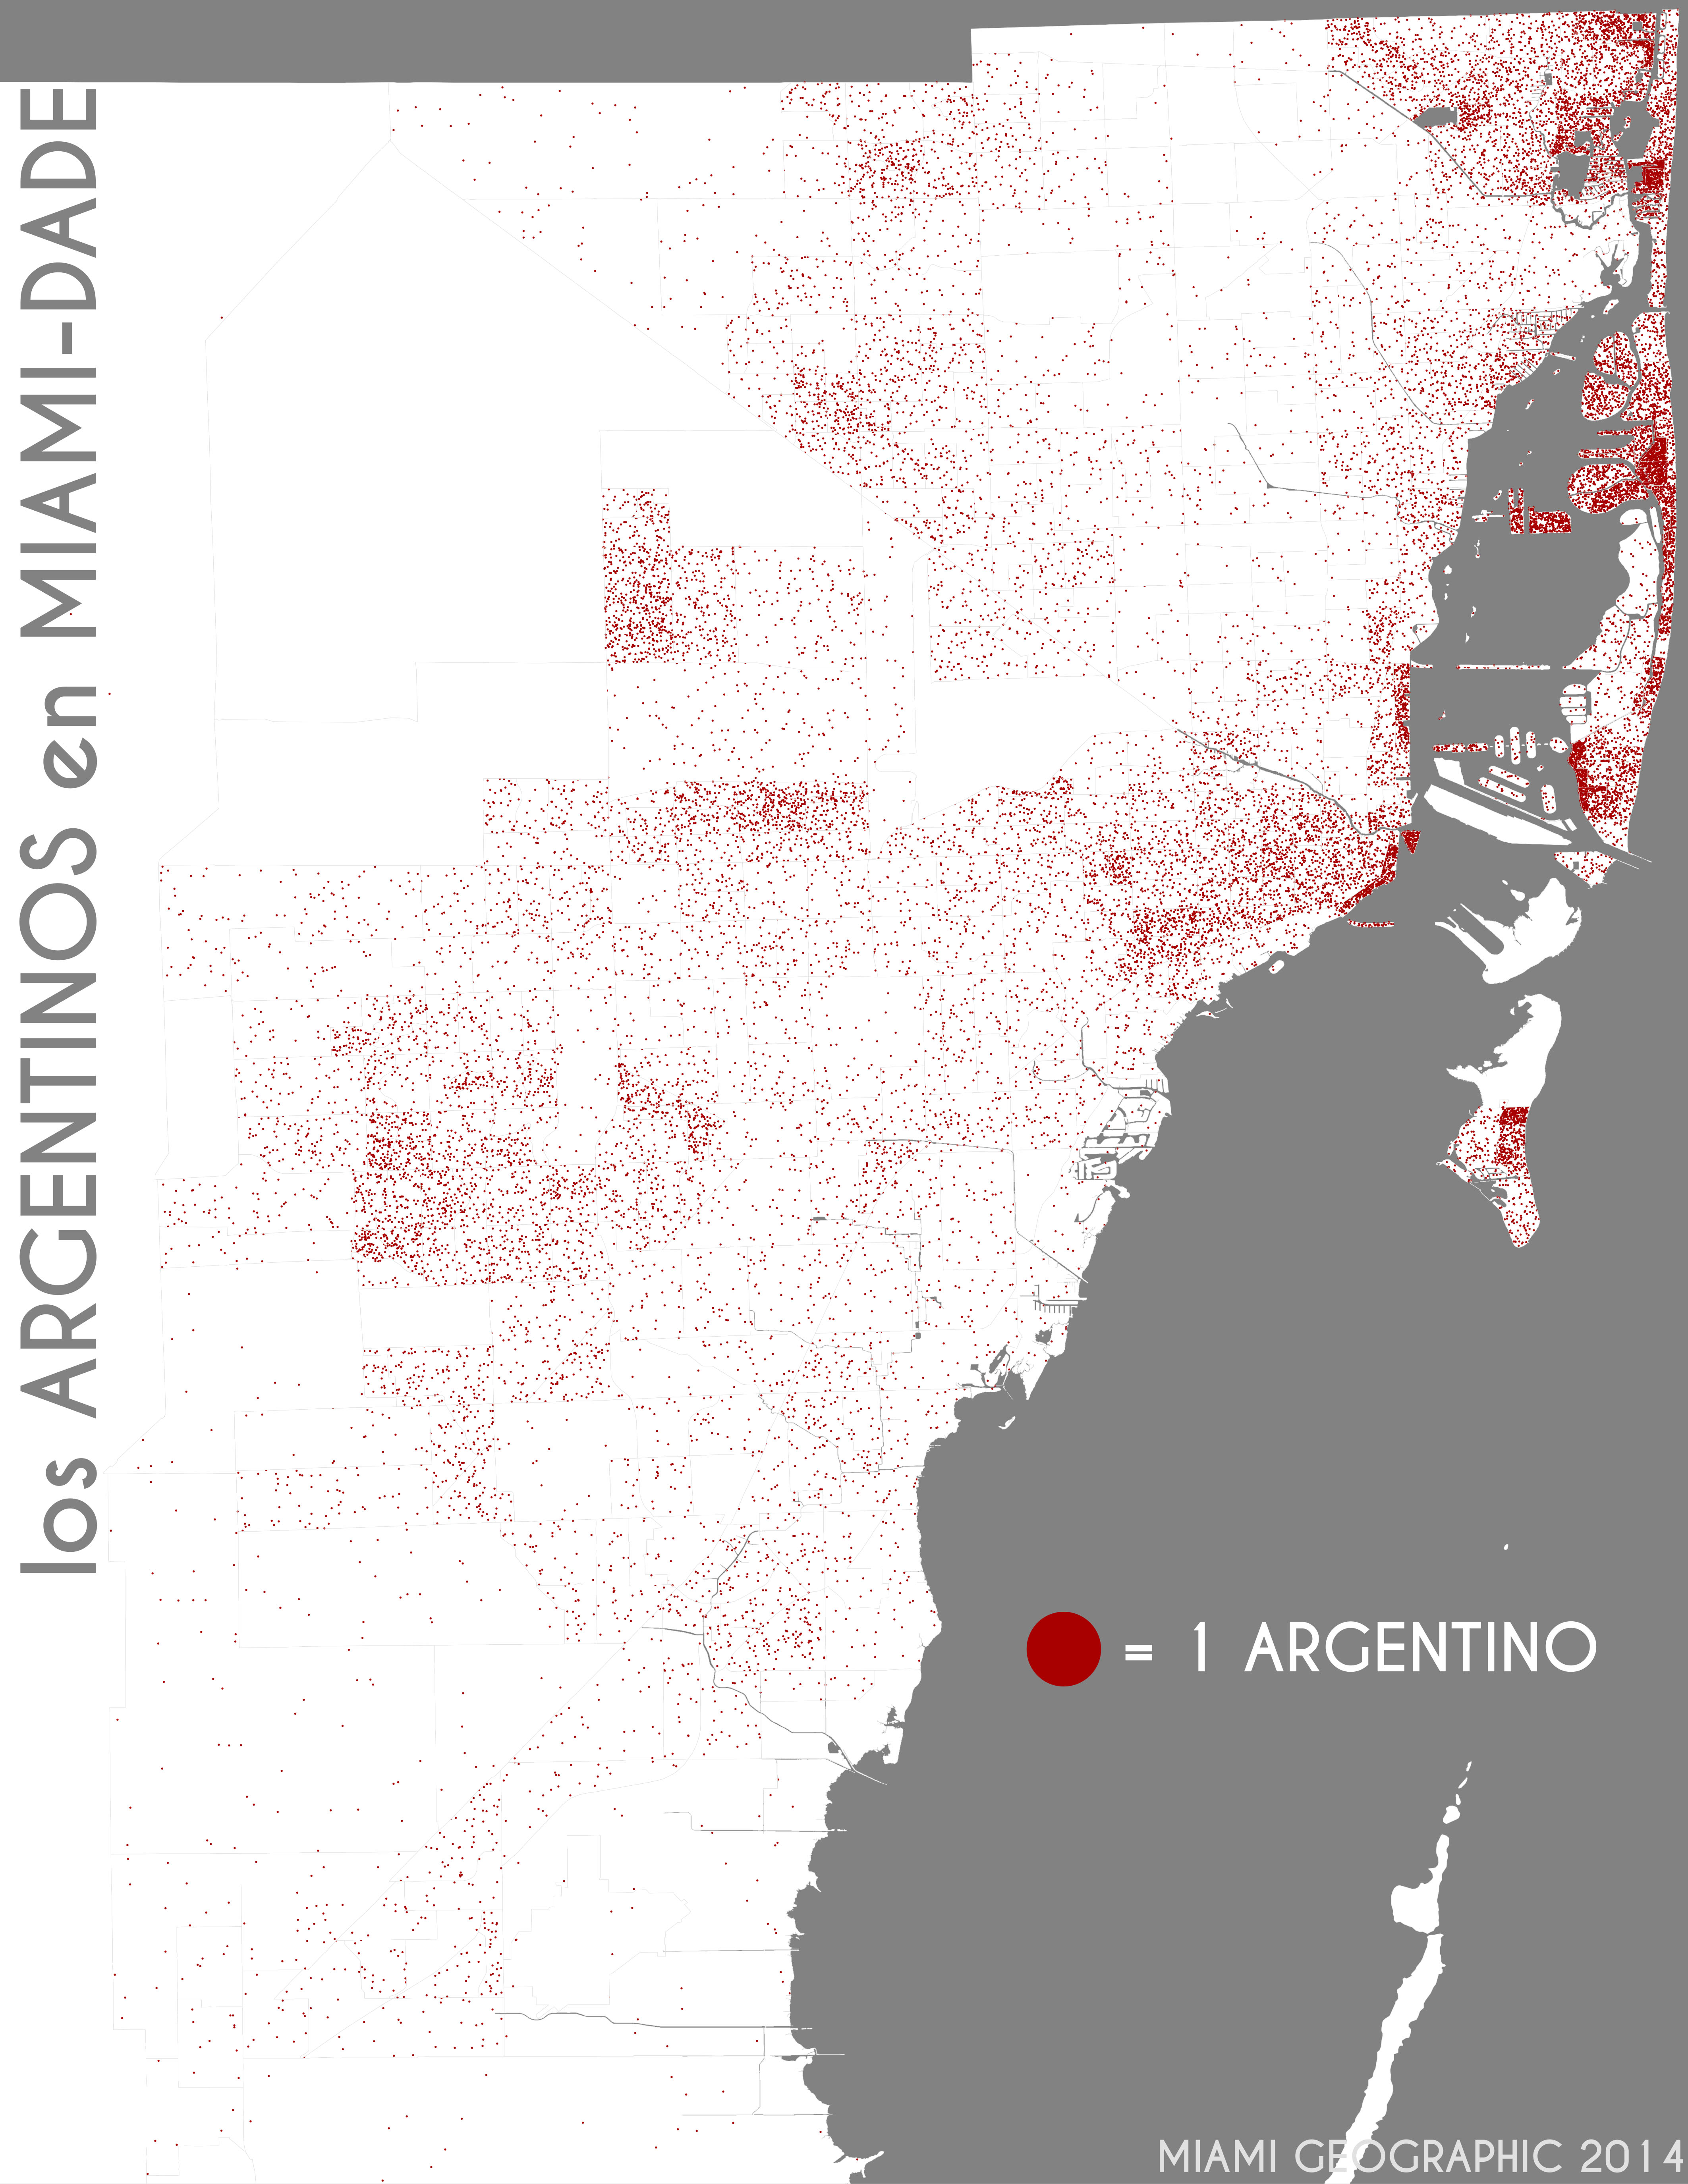
Los argentinos en Miami-Dade. Data Source: 2010 Decennial Census. Map Source: Matthew Toro. 2014.
Bolivians
The Bolivians . . . well, the Bolivians are pretty thinly scattered throughout the county. We’ve yet to see a major influx of Bolivians thus far. For the most part, they seem to prefer the southern side of things, with notable pockets in Miami proper and Doral, of course.

Los bolivianos en Miami-Dade. Data Source: 2010 Decennial Census. Map Source: Matthew Toro. 2014.
Chileans
When they’re not living on Miami Beach or the other islands, South American groups, like the Chileans, seem to prefer the municipalities and unincorporated reaches in the western part of Miami-Dade County.
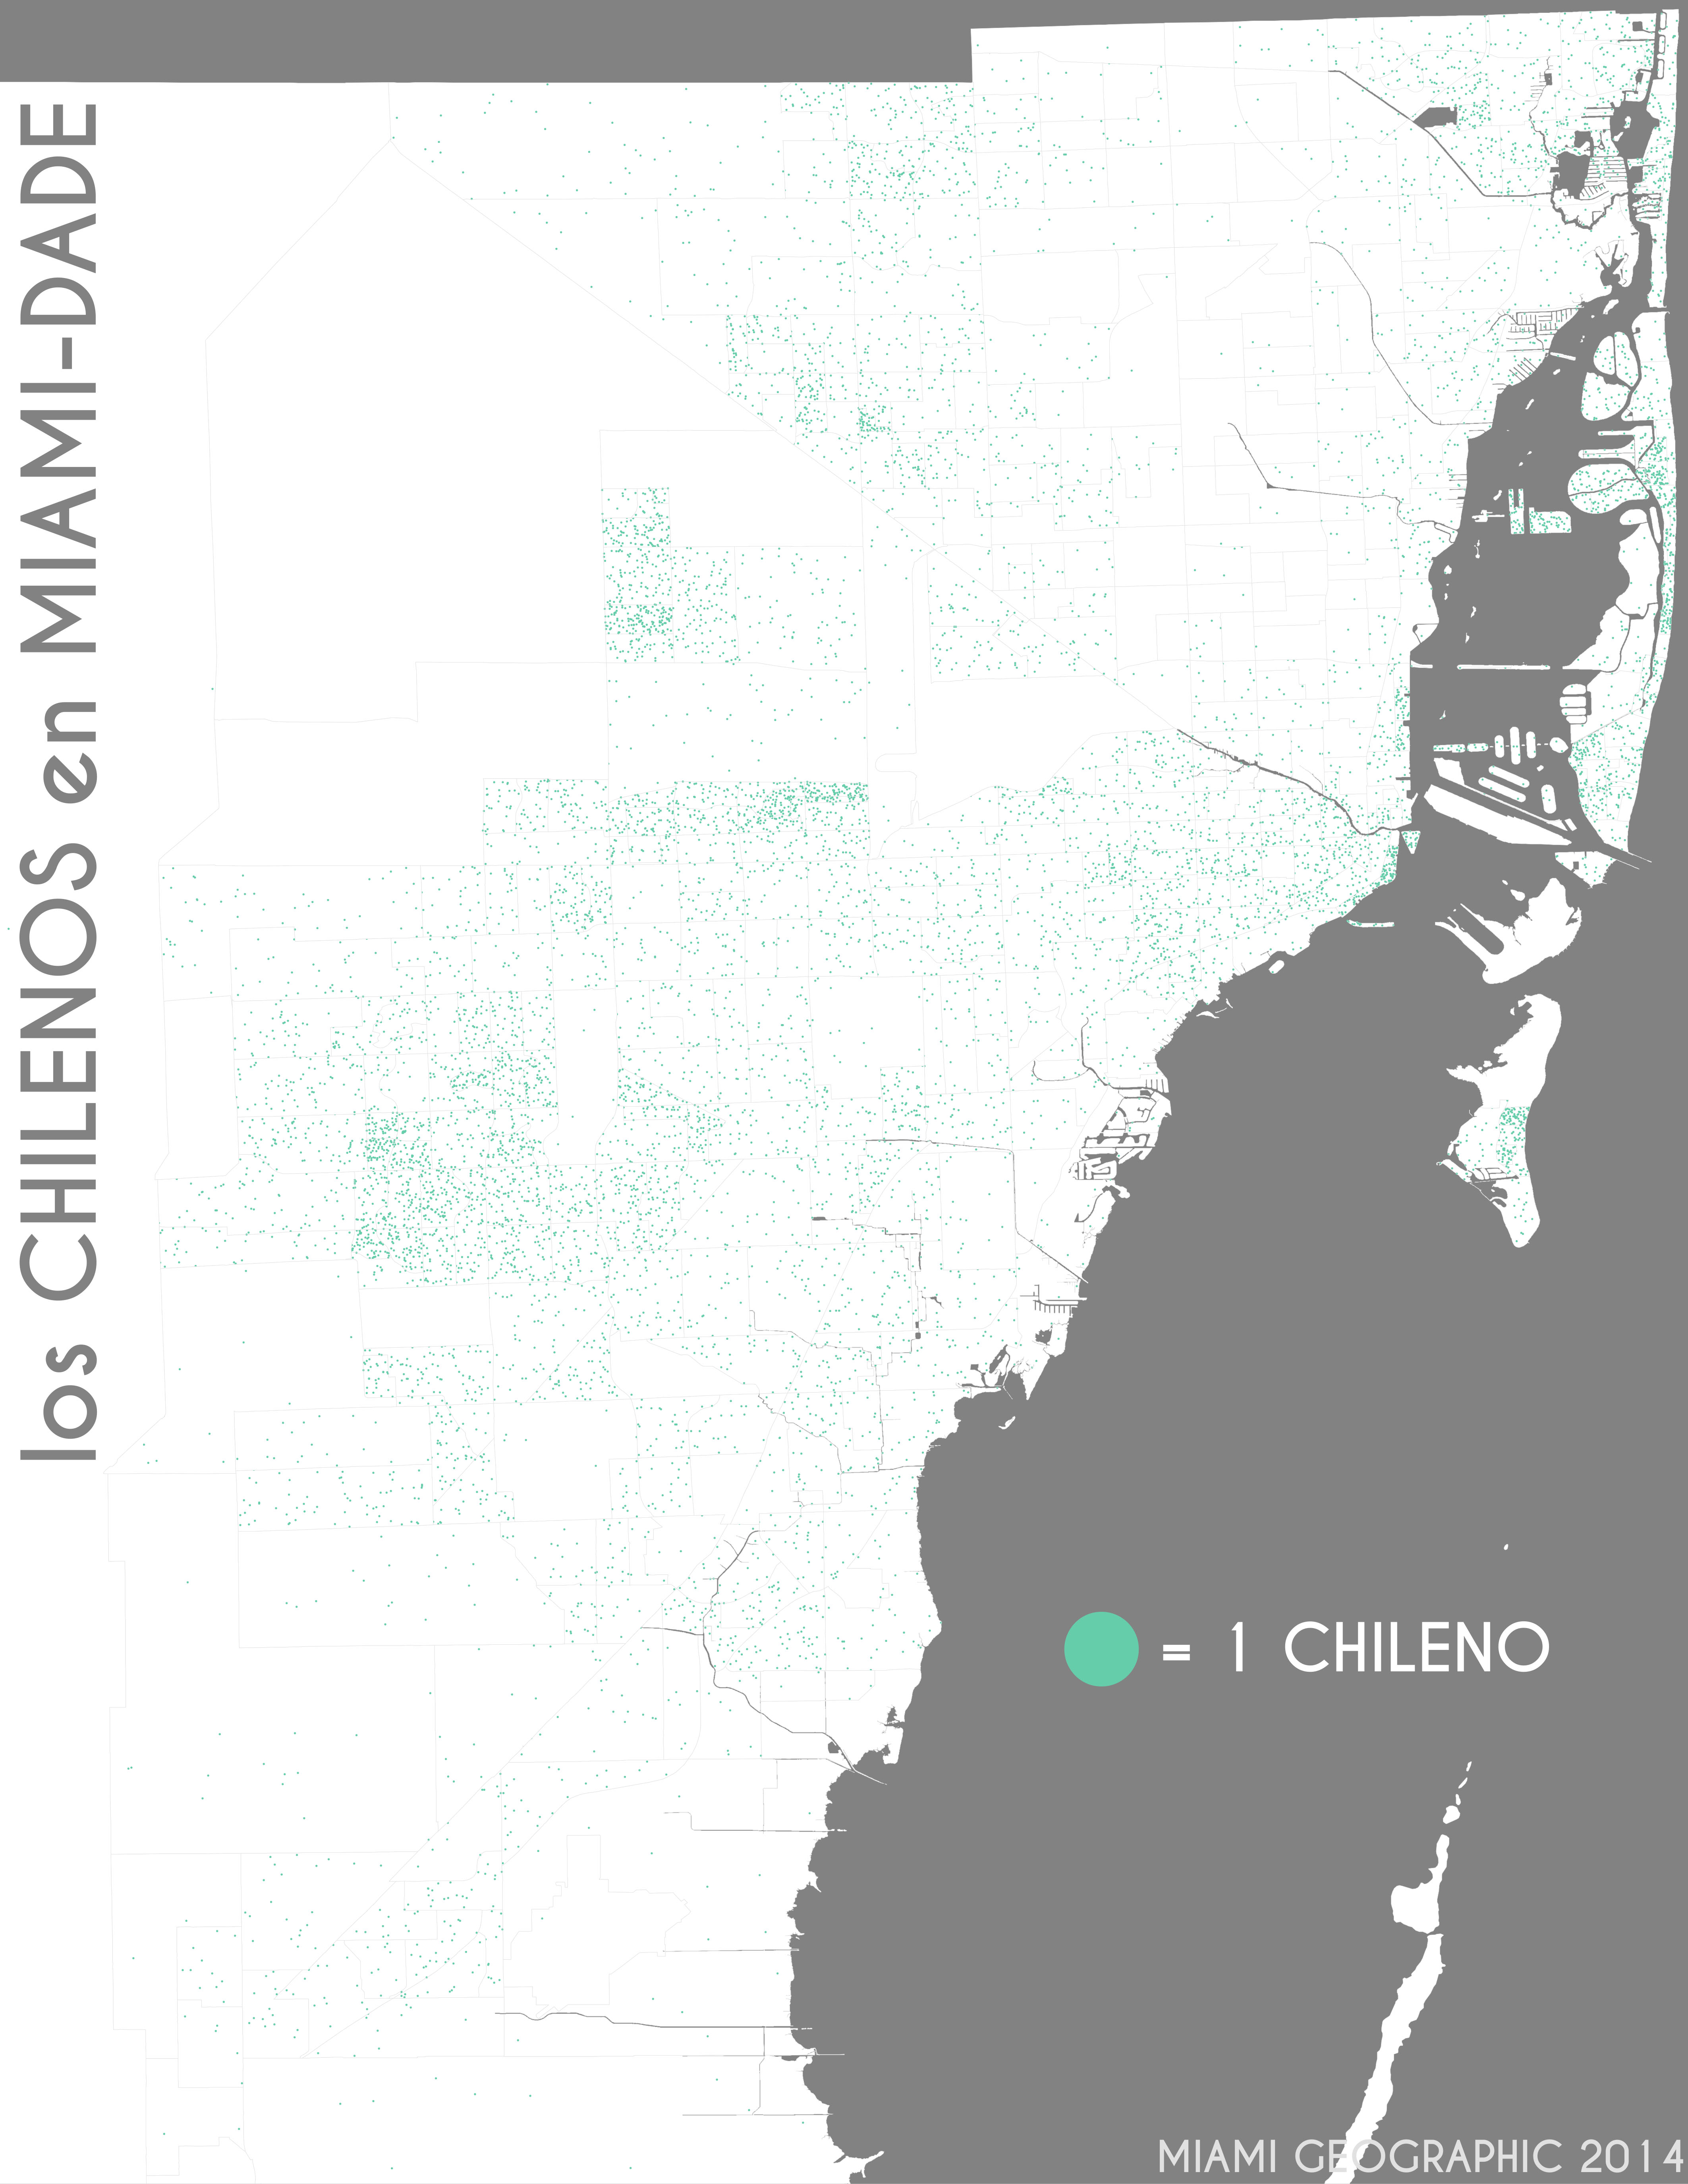
Los chilenos en Miami-Dade. Data Source: 2010 Decennial Census. Map Source: Matthew Toro. 2014.
Colombians
Colombians have a sizeable presence in Miami-Dade County, but they’re most concentrated around the edges and corners of the county, in places like downtown Miami, southwest Kendall (unincorporated Miami-Dade), Doral, the Miami Lakes area, and Aventura.
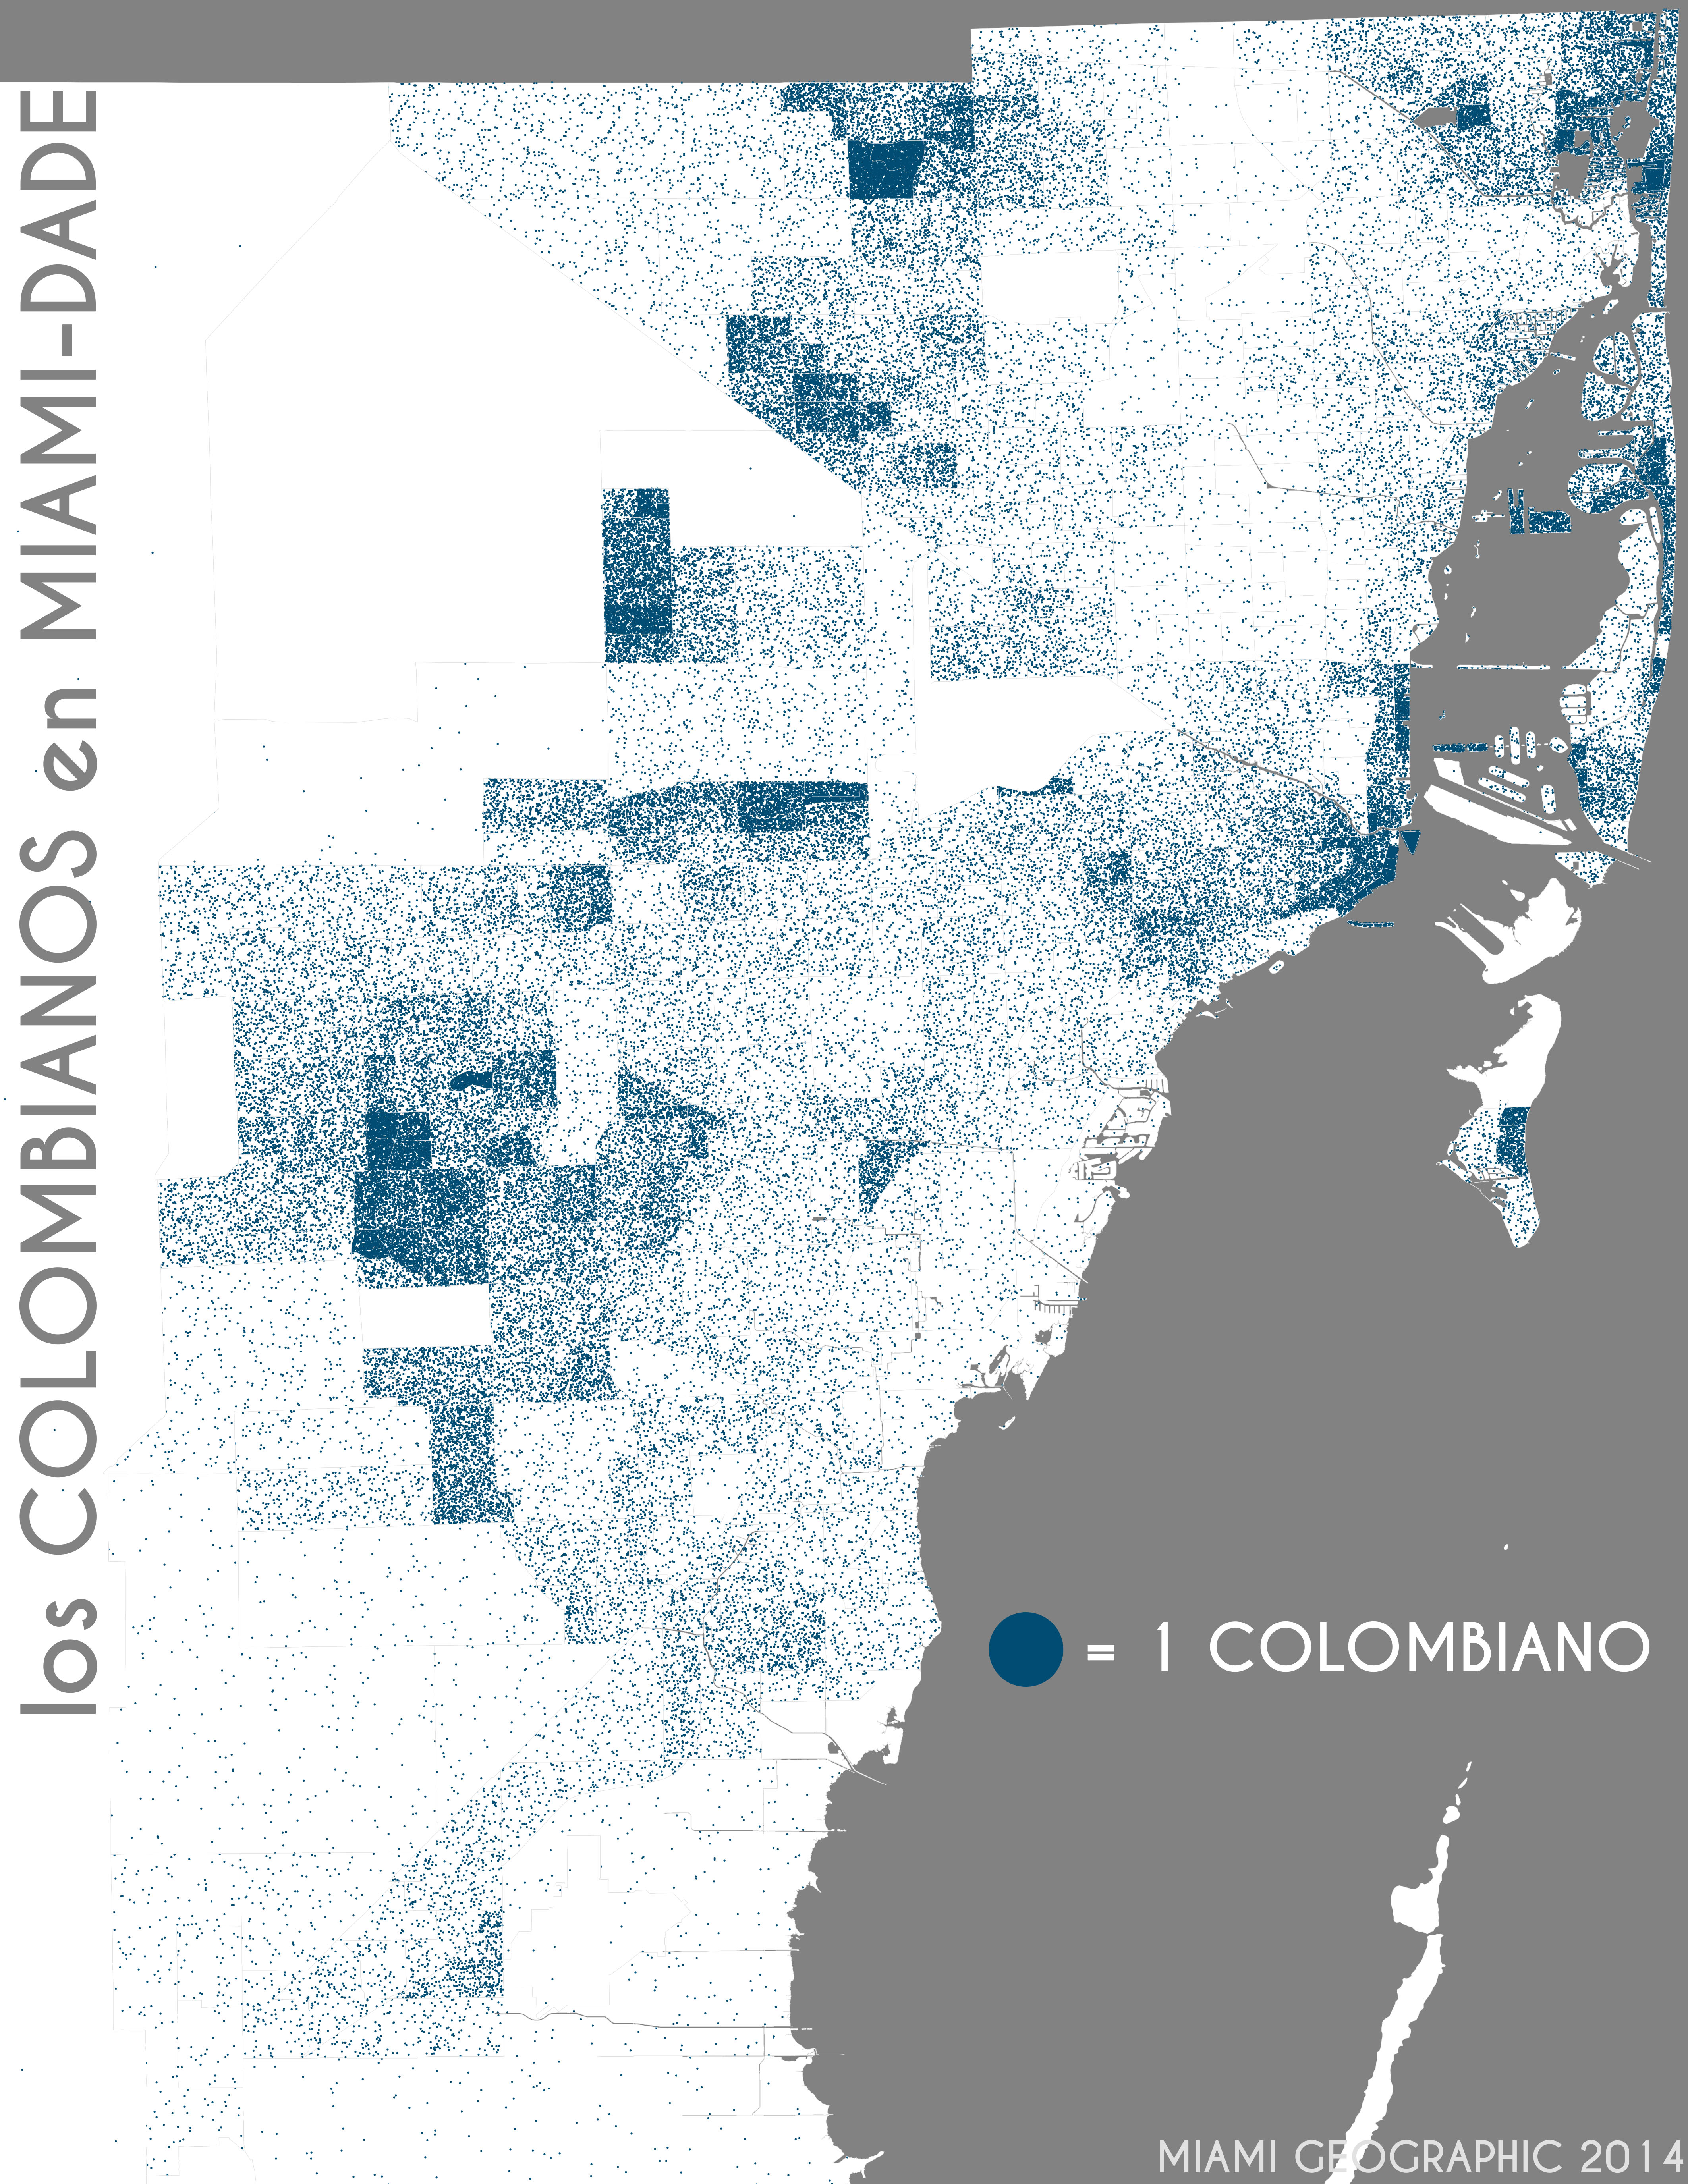
Los colombianos en Miami-Dade. Data Source: 2010 Decennial Census. Map Source: Matthew Toro. 2014.
Costa Ricans
Los ticos don’t have the strongest population presence in Miami-Dade County, but there seems to a faint, but discernible, suburban affinity among the comparatively low numbers we can find.

Los costarricenses en Miami-Dade. Data Source: 2010 Decennial Census. Map Source: Matthew Toro. 2014.
Cubans
Cubans . . . well . . . the map speaks for itself.

Los cubanos en Miami-Dade. Data Source: 2010 Decennial Census. Map Source: Matthew Toro. 2014.
Dominicans
The map for Dominicans is quite interesting. We find most Dominicans in the northwest portions of the City of Miami. There’s a pretty dense area of Dominicans up in Miami Lakes as well, not to mention where the municipalities of Hialeah, Hialeah Gardens , and Medley meet.
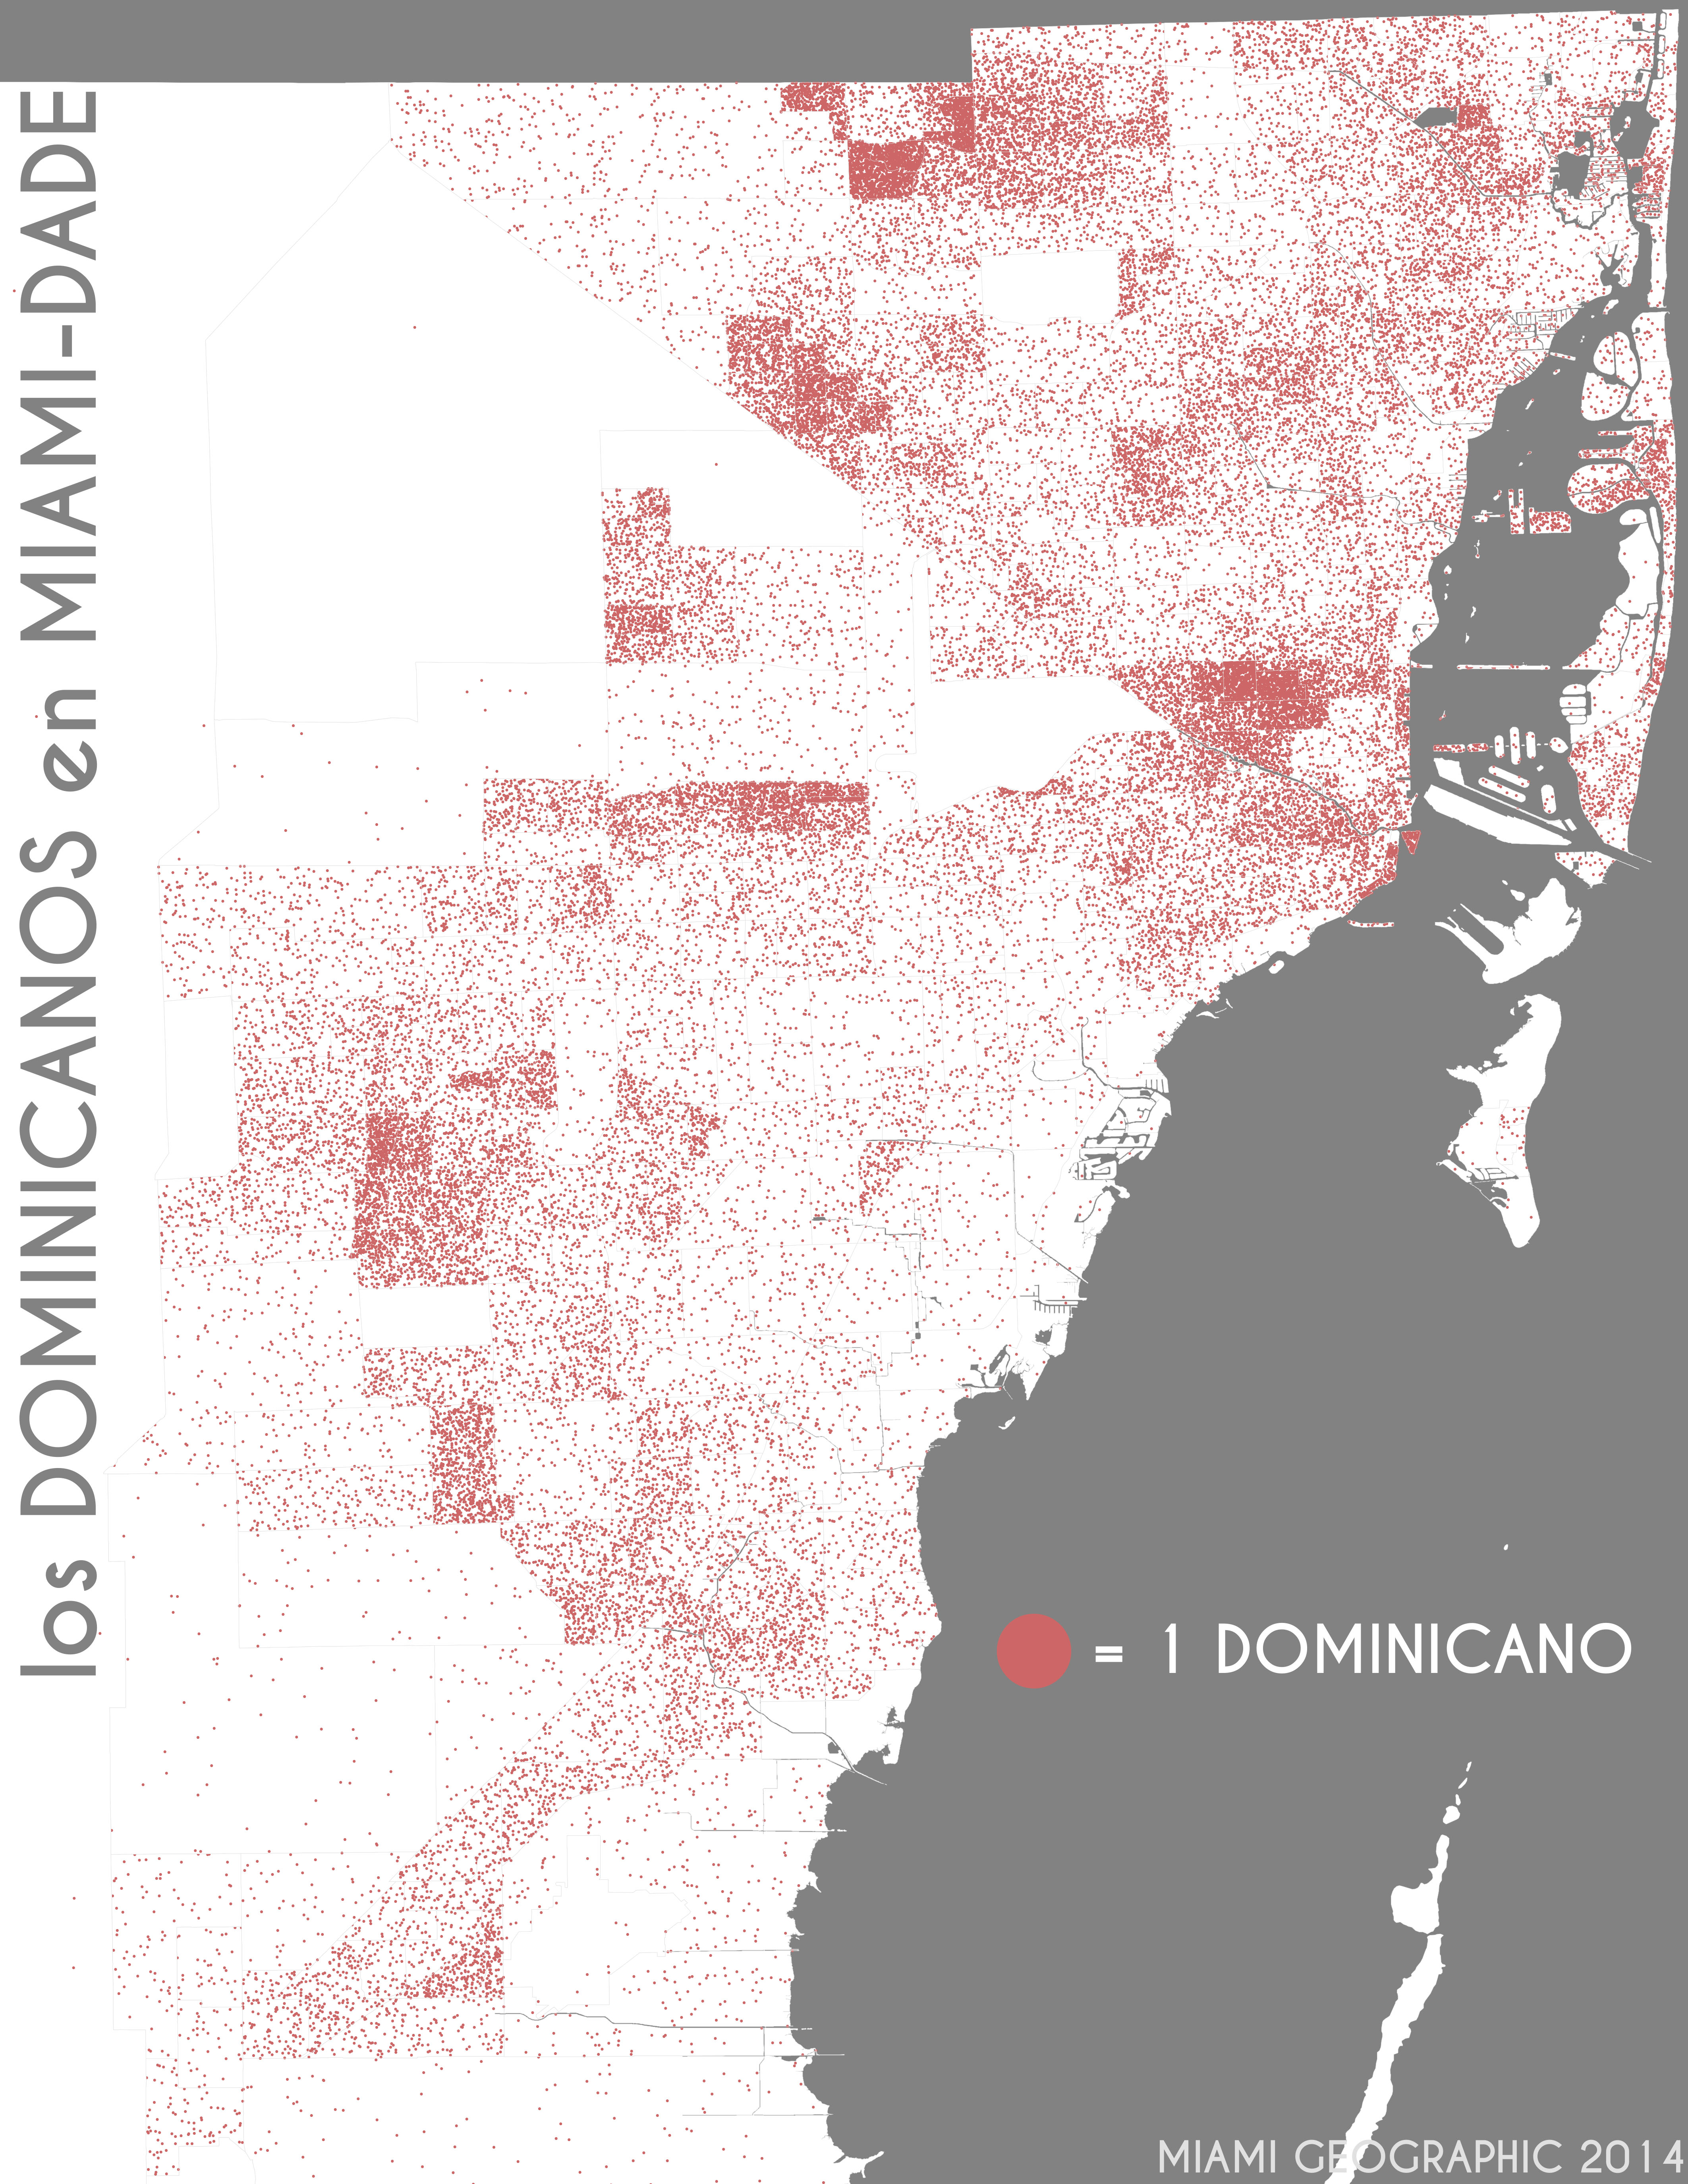
Los dominicanos en Miami-Dade. Data Source: 2010 Decennial Census. Map Source: Matthew Toro. 2014.
Ecuadorians
Ecuadorians, like our other South American friends, are found either in the western suburbs — including, of course, those of Miami Lakes, Doral and west Kendall — or in downtown, with a few small, yet nevertheless notable pockets along the island coasts.
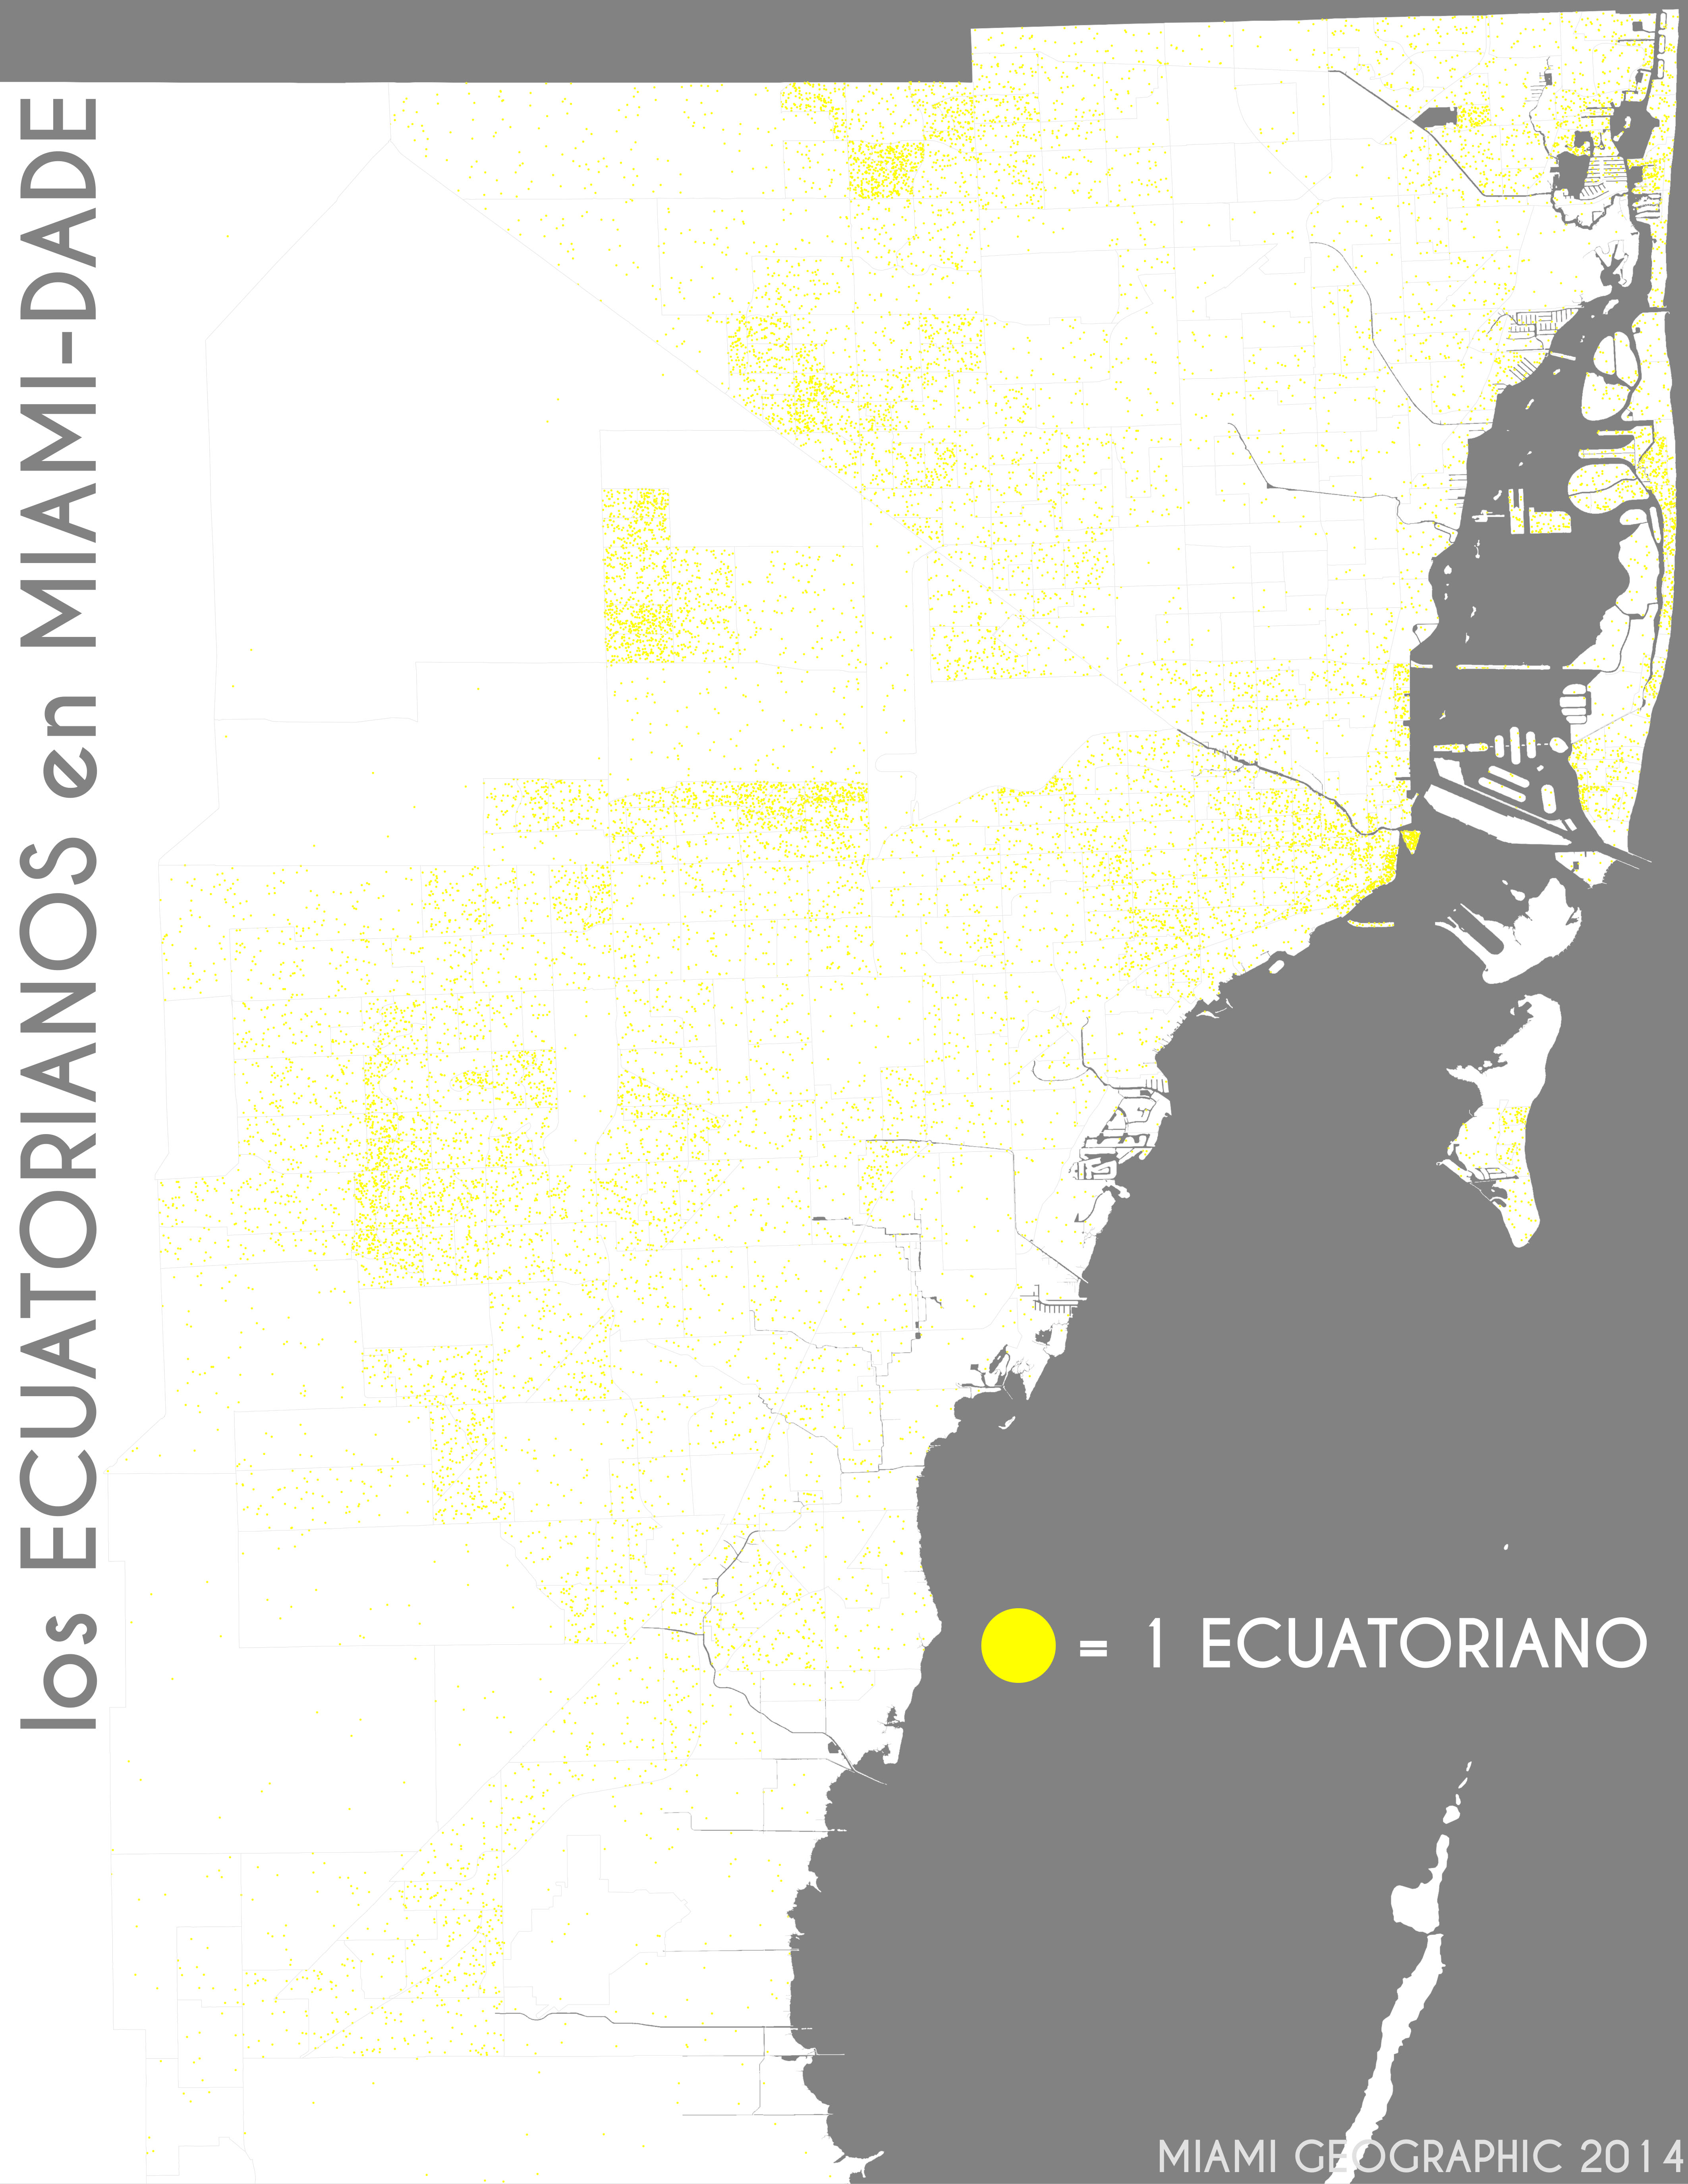
Los ecuatorianos en Miami-Dade. Data Source: 2010 Decennial Census. Map Source: Matthew Toro. 2014.
Guatemalans
Things get interesting with los chapines. Guatemalans are located primarily down south in the Homestead / Florida City area, or in downtown Miami (on the west side of the river, in East Little Havana), or downtown Miami Beach.
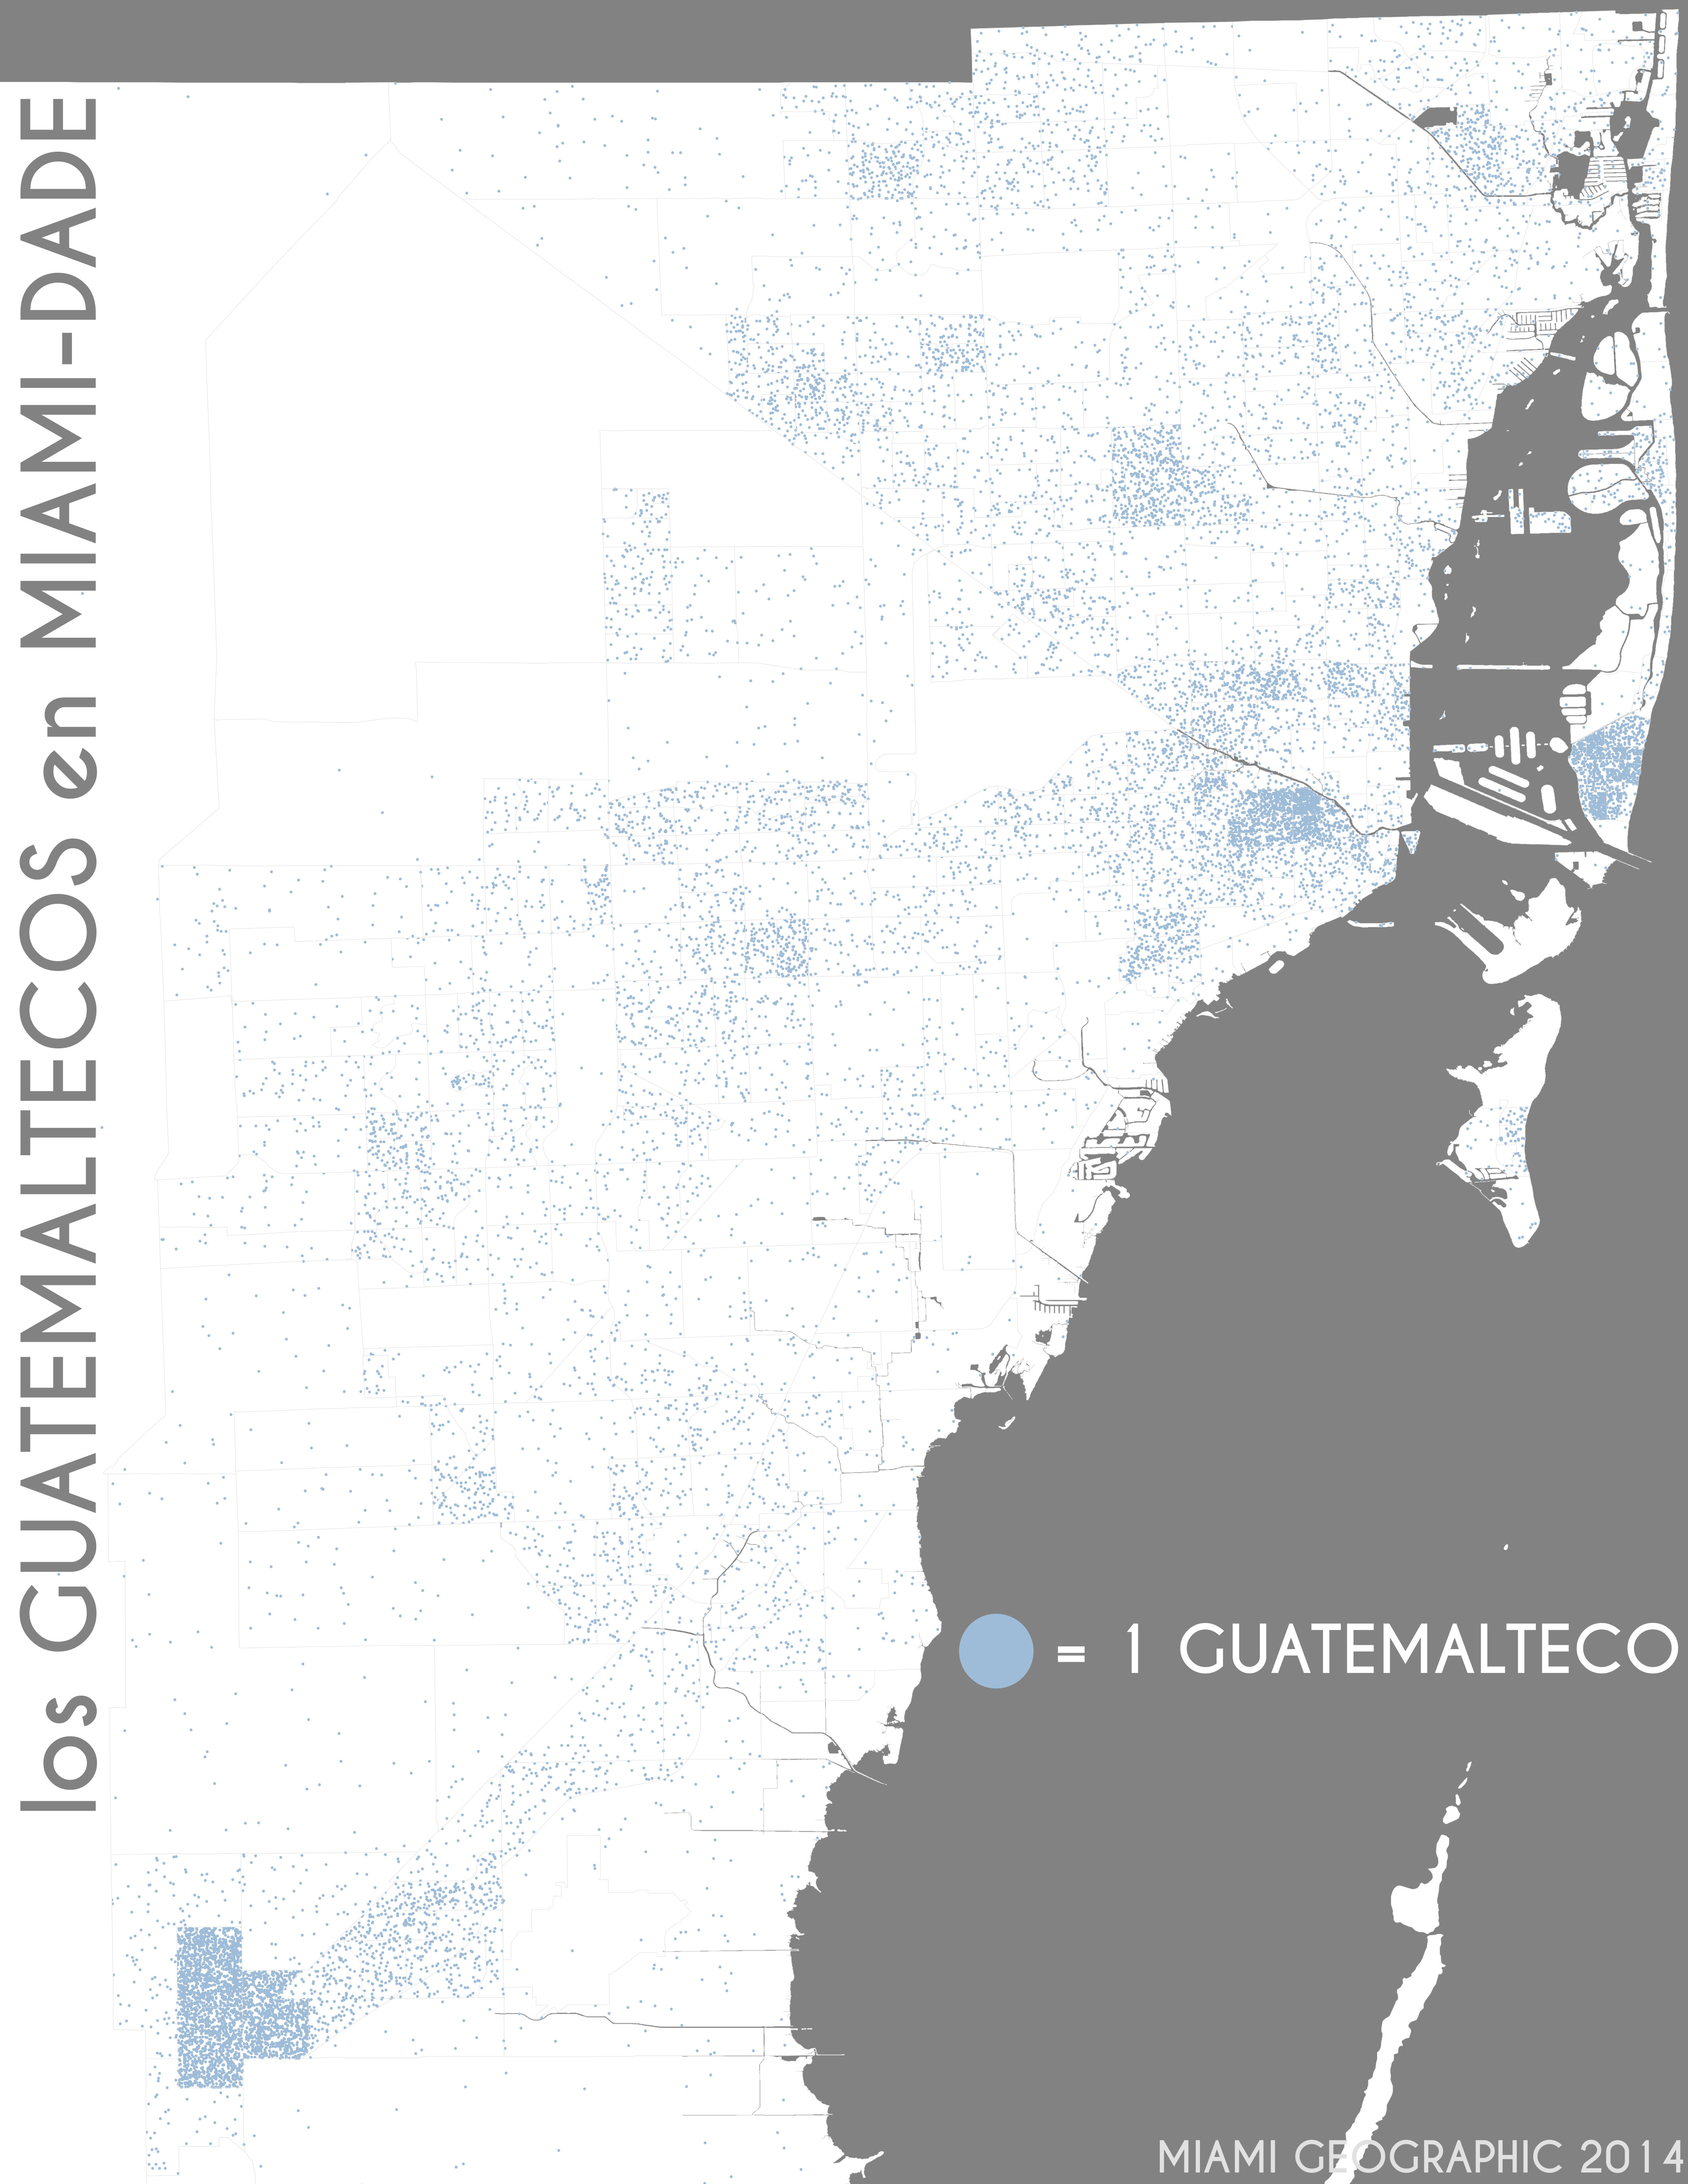
Los guatemaltecos en Miami-Dade. Data Source: 2010 Decennial Census. Map Source: Matthew Toro. 2014.
Hondurans
Hondurans, like their Central American counterparts, are most significantly centered in Little Havana, but they have good-sized pockets all over the place.

Los hondureños en Miami-Dade. Data Source: 2010 Decennial Census. Map Source: Matthew Toro. 2014.
Mexicans
The case of Mexicans in Miami is a striking one. They’re for the most part concentrated in Homestead and Florida City, near the industrial farms in the Redland Agricultural Area (the “Redland”). Pockets of Mexicans are found in Doral, downtown, Aventura, Miami-Beach, but they’re overwhelmingly concentrated in the deep southwest.
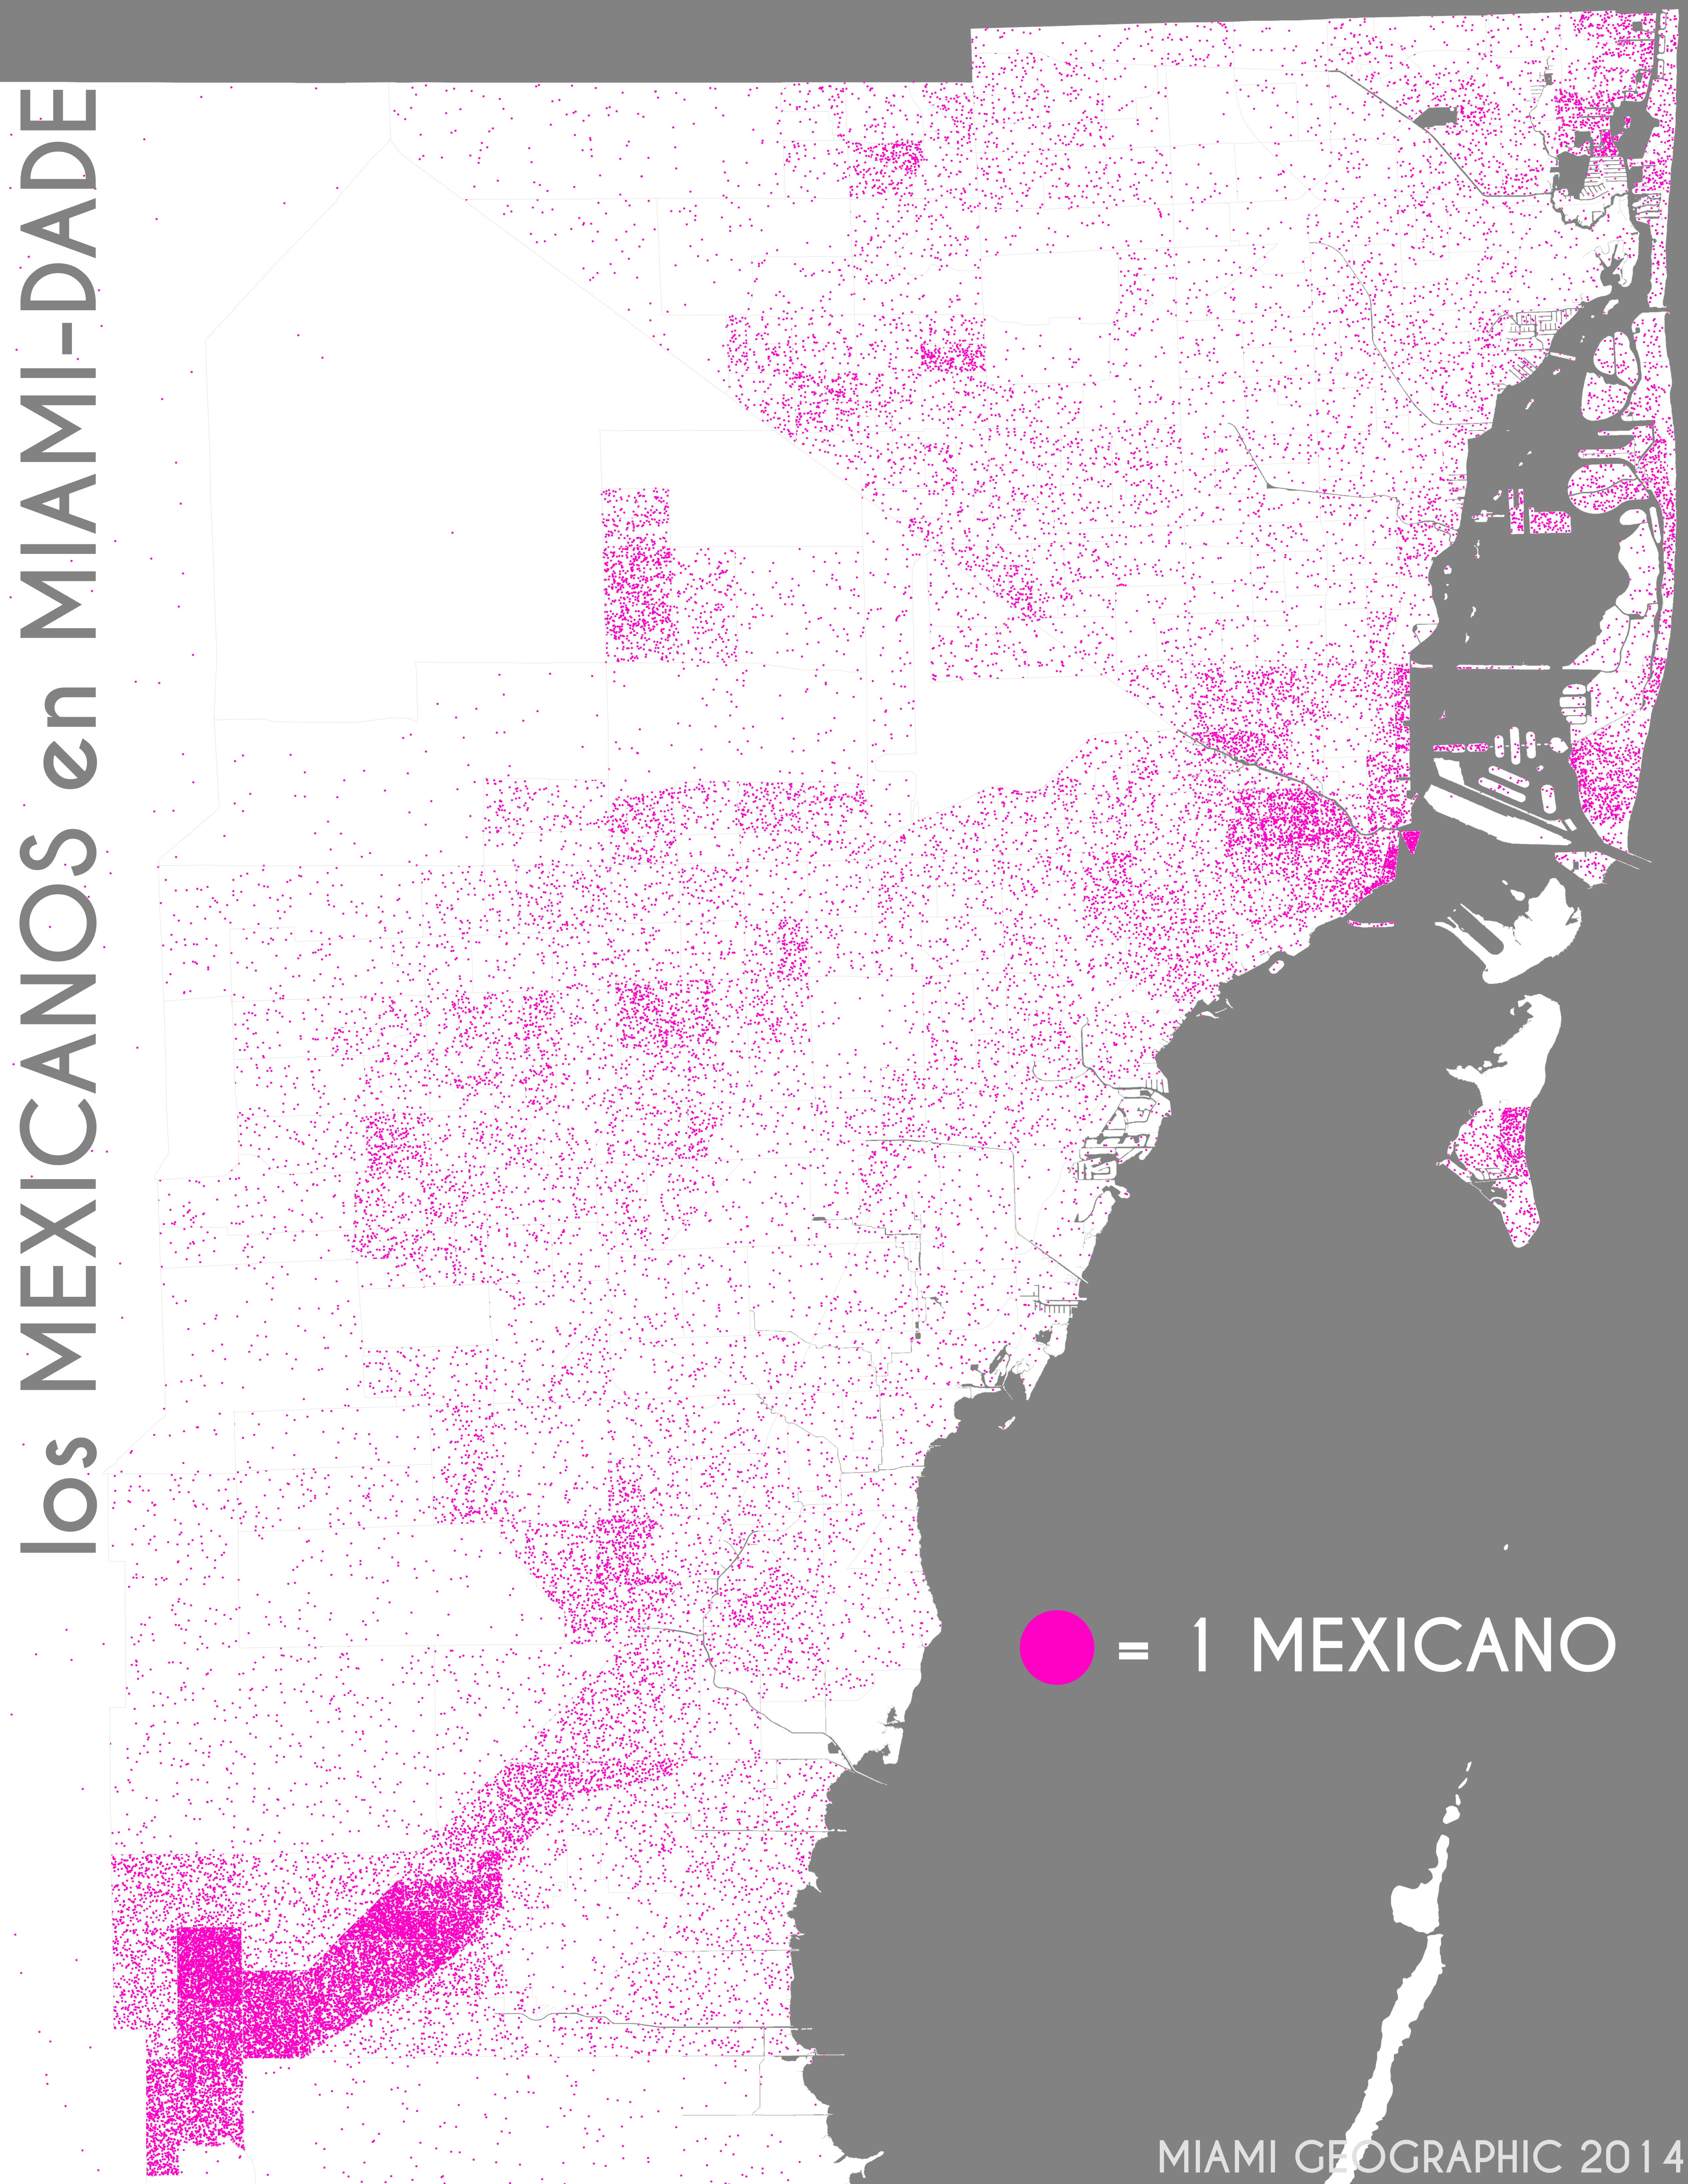
Los mexicanos en Miami-Dade. Data Source: 2010 Decennial Census. Map Source: Matthew Toro. 2014.
Nicaraguans
Nicaraguans have really begun to plant their roots in greater Miami. Just look at their numbers along Okeechobee highway, from Hialeah to virtually every corner of Little Havana. Don’t forget the pockets along SW 8th street, as one gets into unincorporated areas like Westchester — Nicaraguans area leaving their mark.
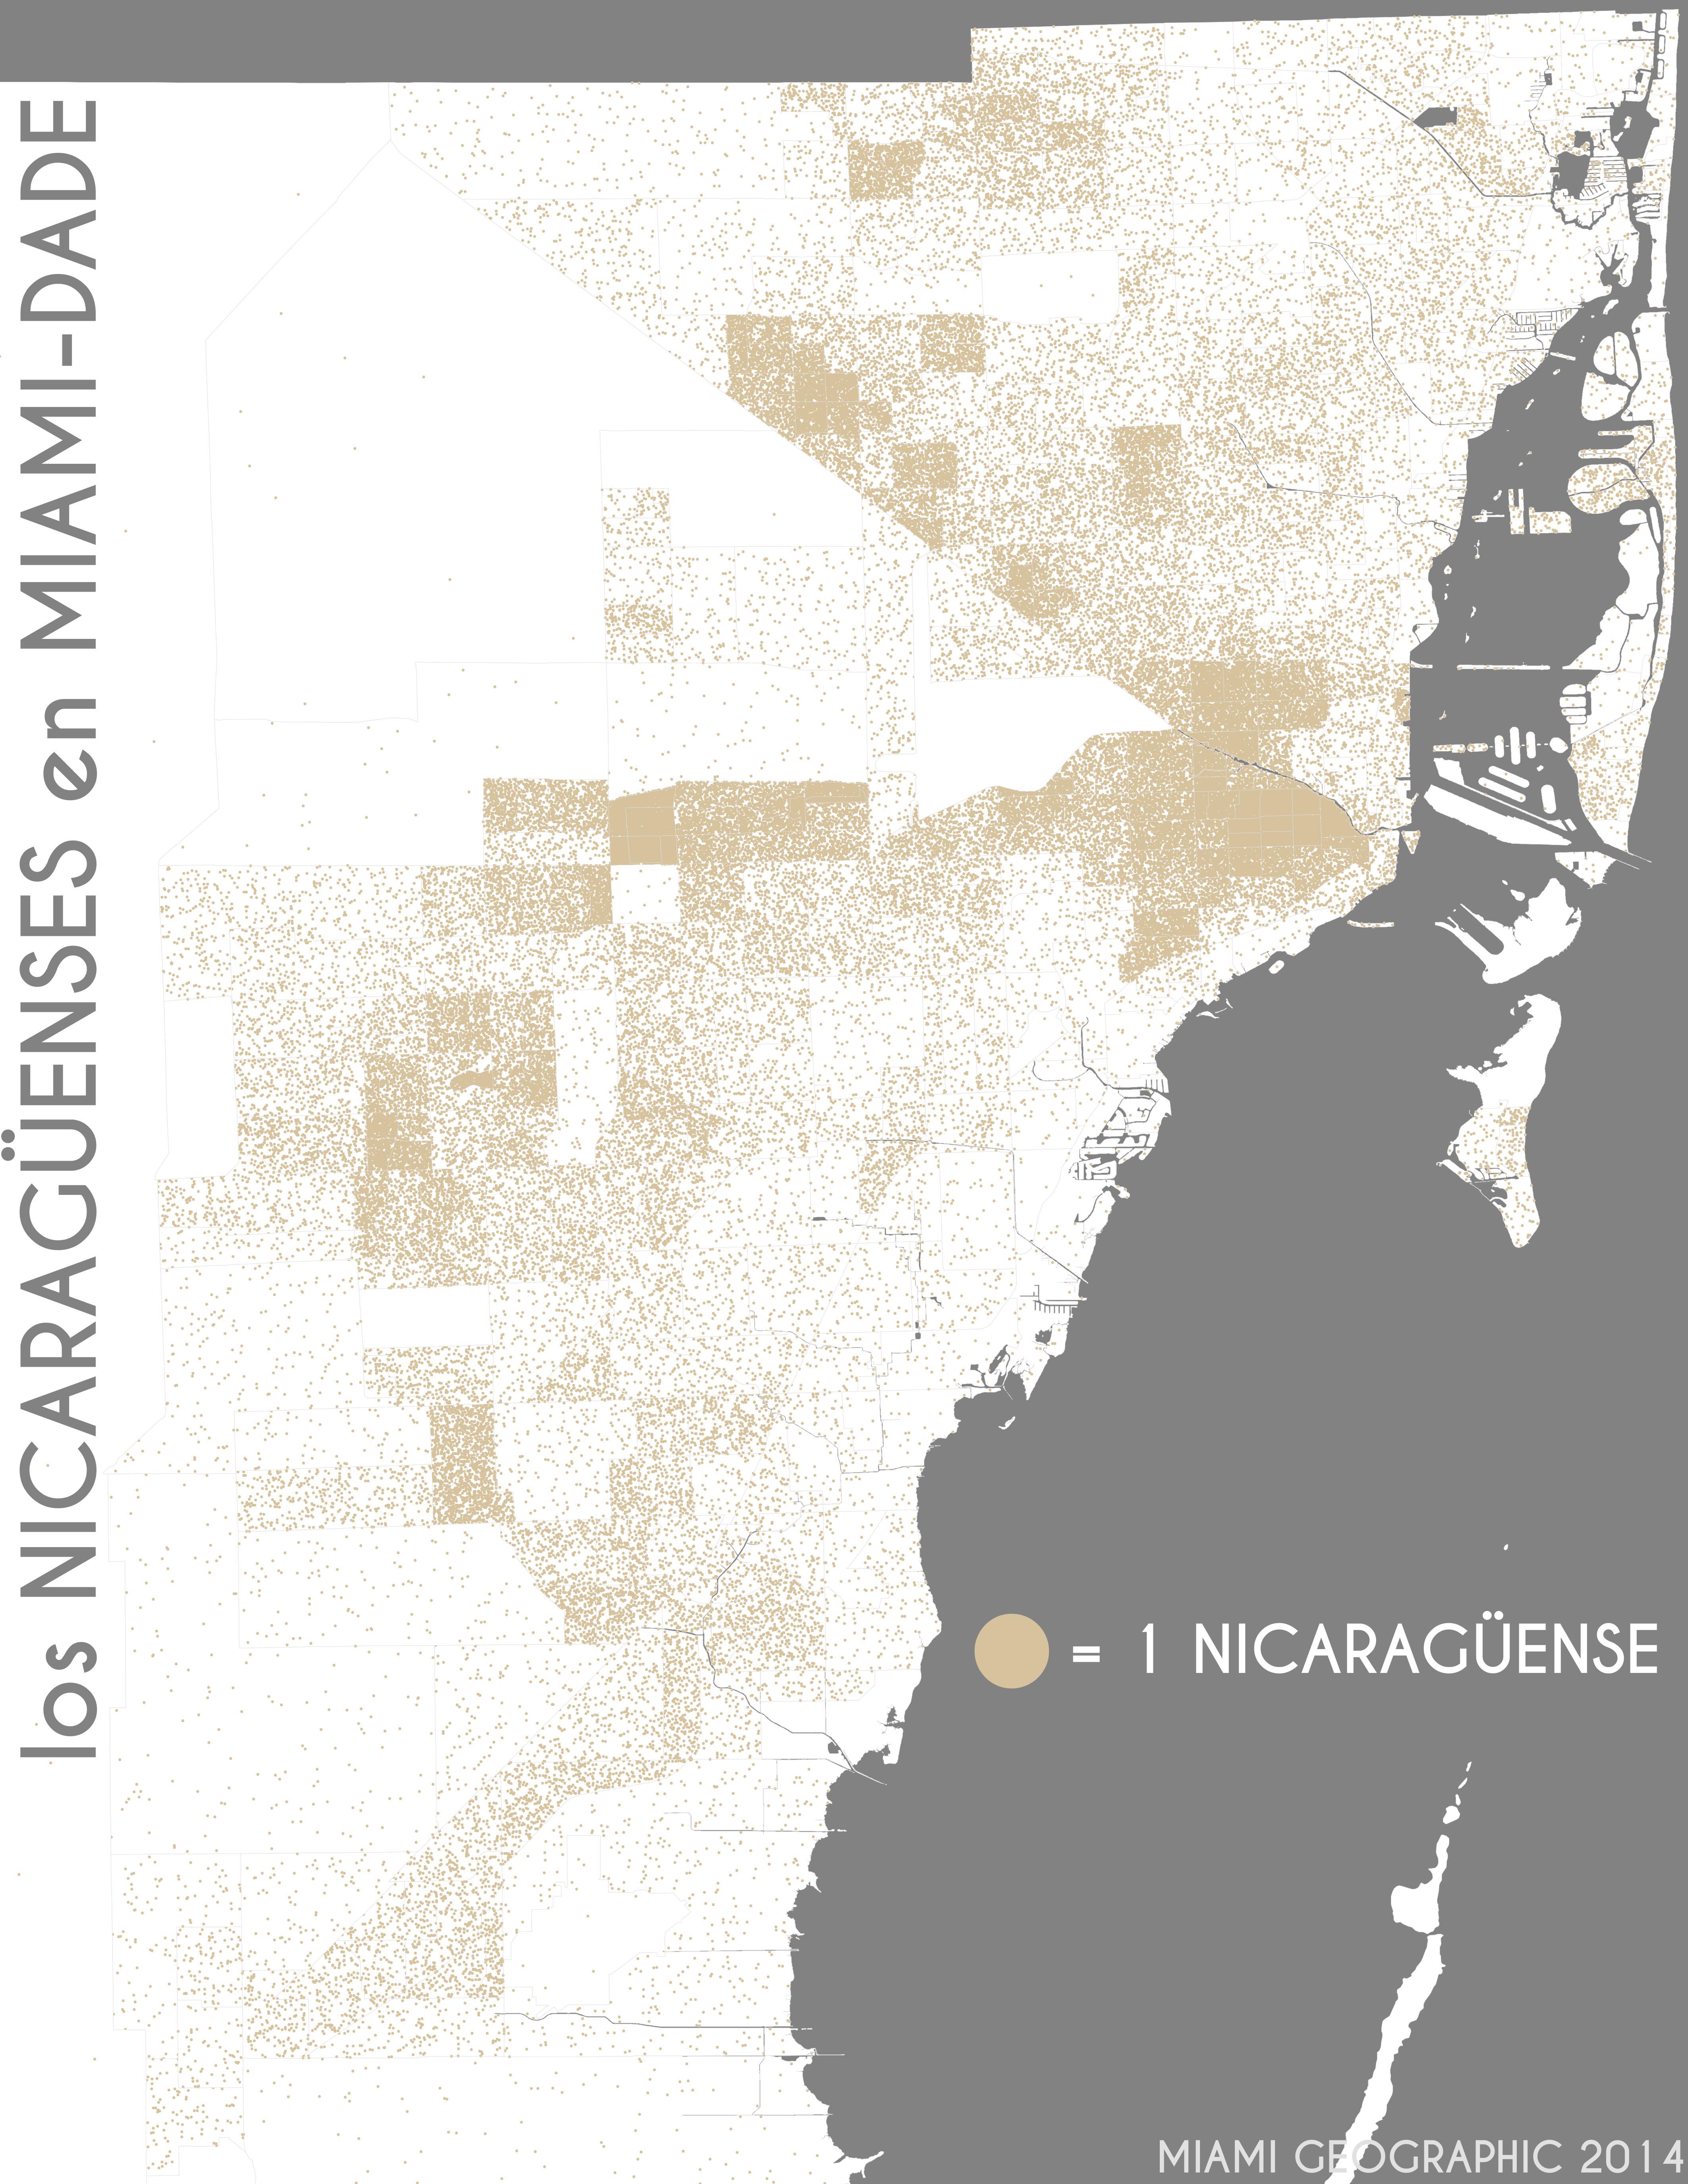
Los nicaragüenses en Miami-Dade. Data Source: 2010 Decennial Census. Map Source: Matthew Toro. 2014.
Panamanians
Panamanians seem to be pretty happy staying in Panama.
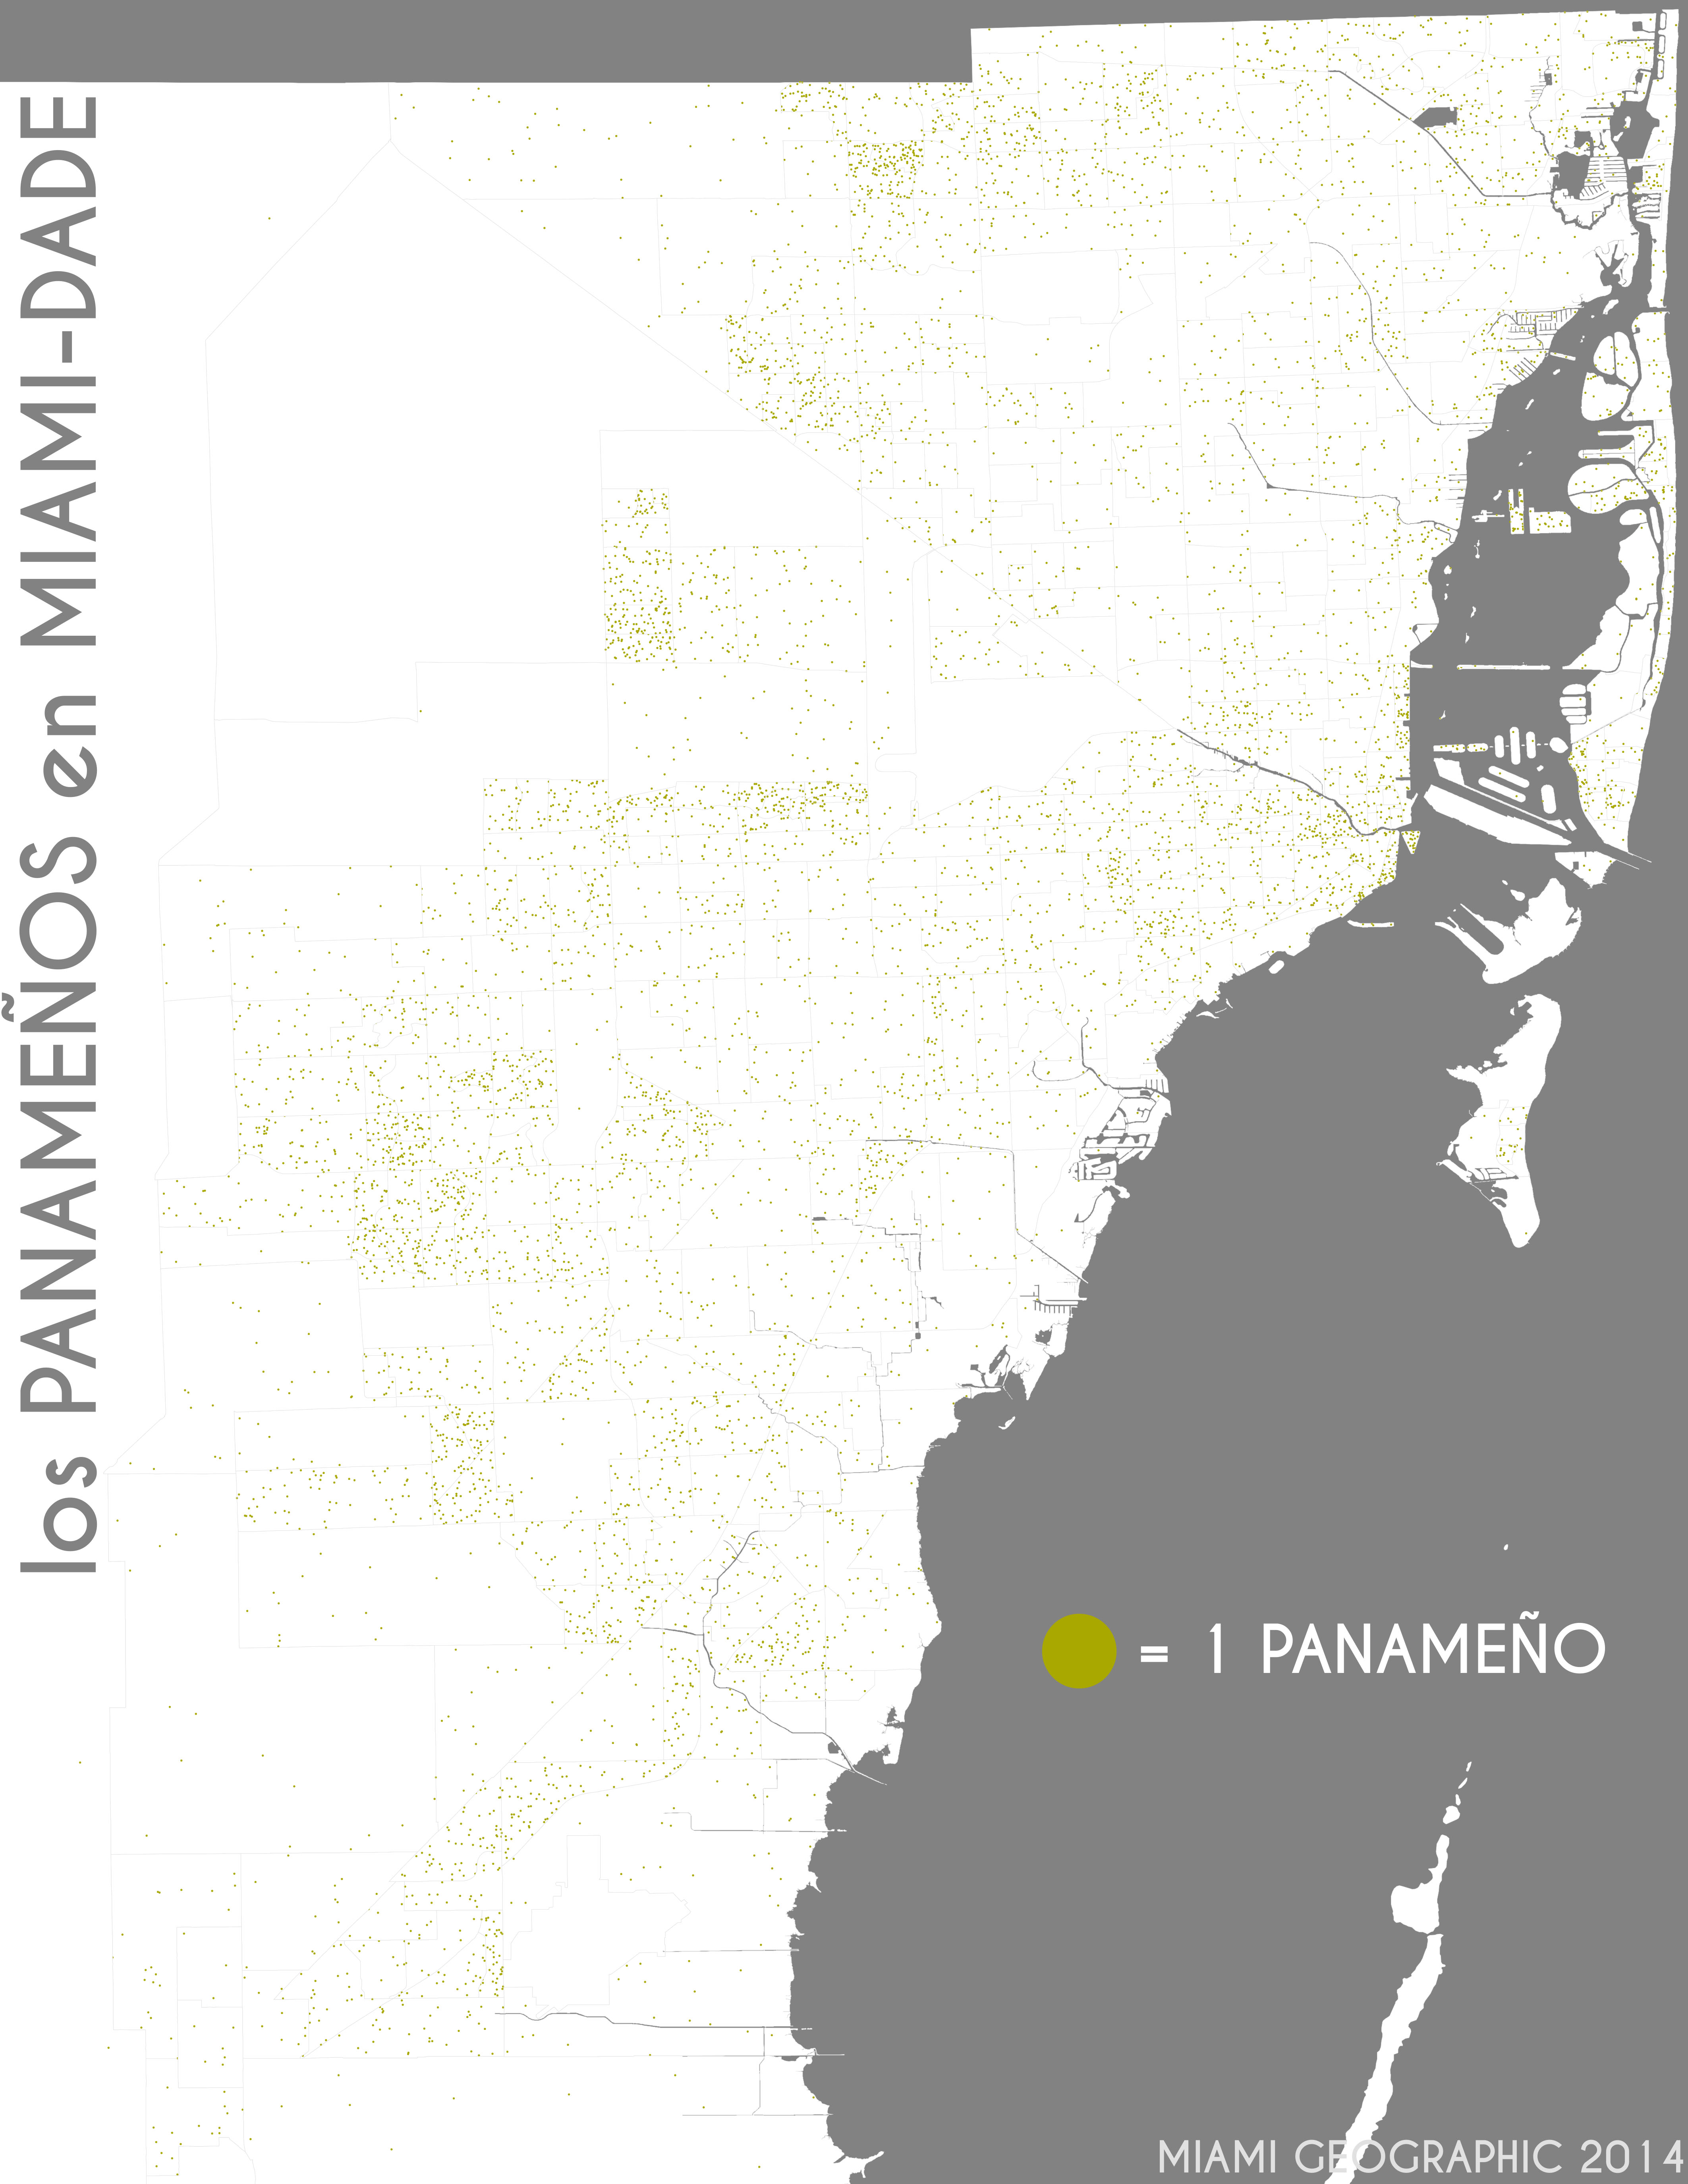
Los panameños en Miami-Dade. Data Source: 2010 Decennial Census. Map Source: Matthew Toro. 2014.
Paraguayans
But Paraguayans appear, by far, the least eager to come live among us.
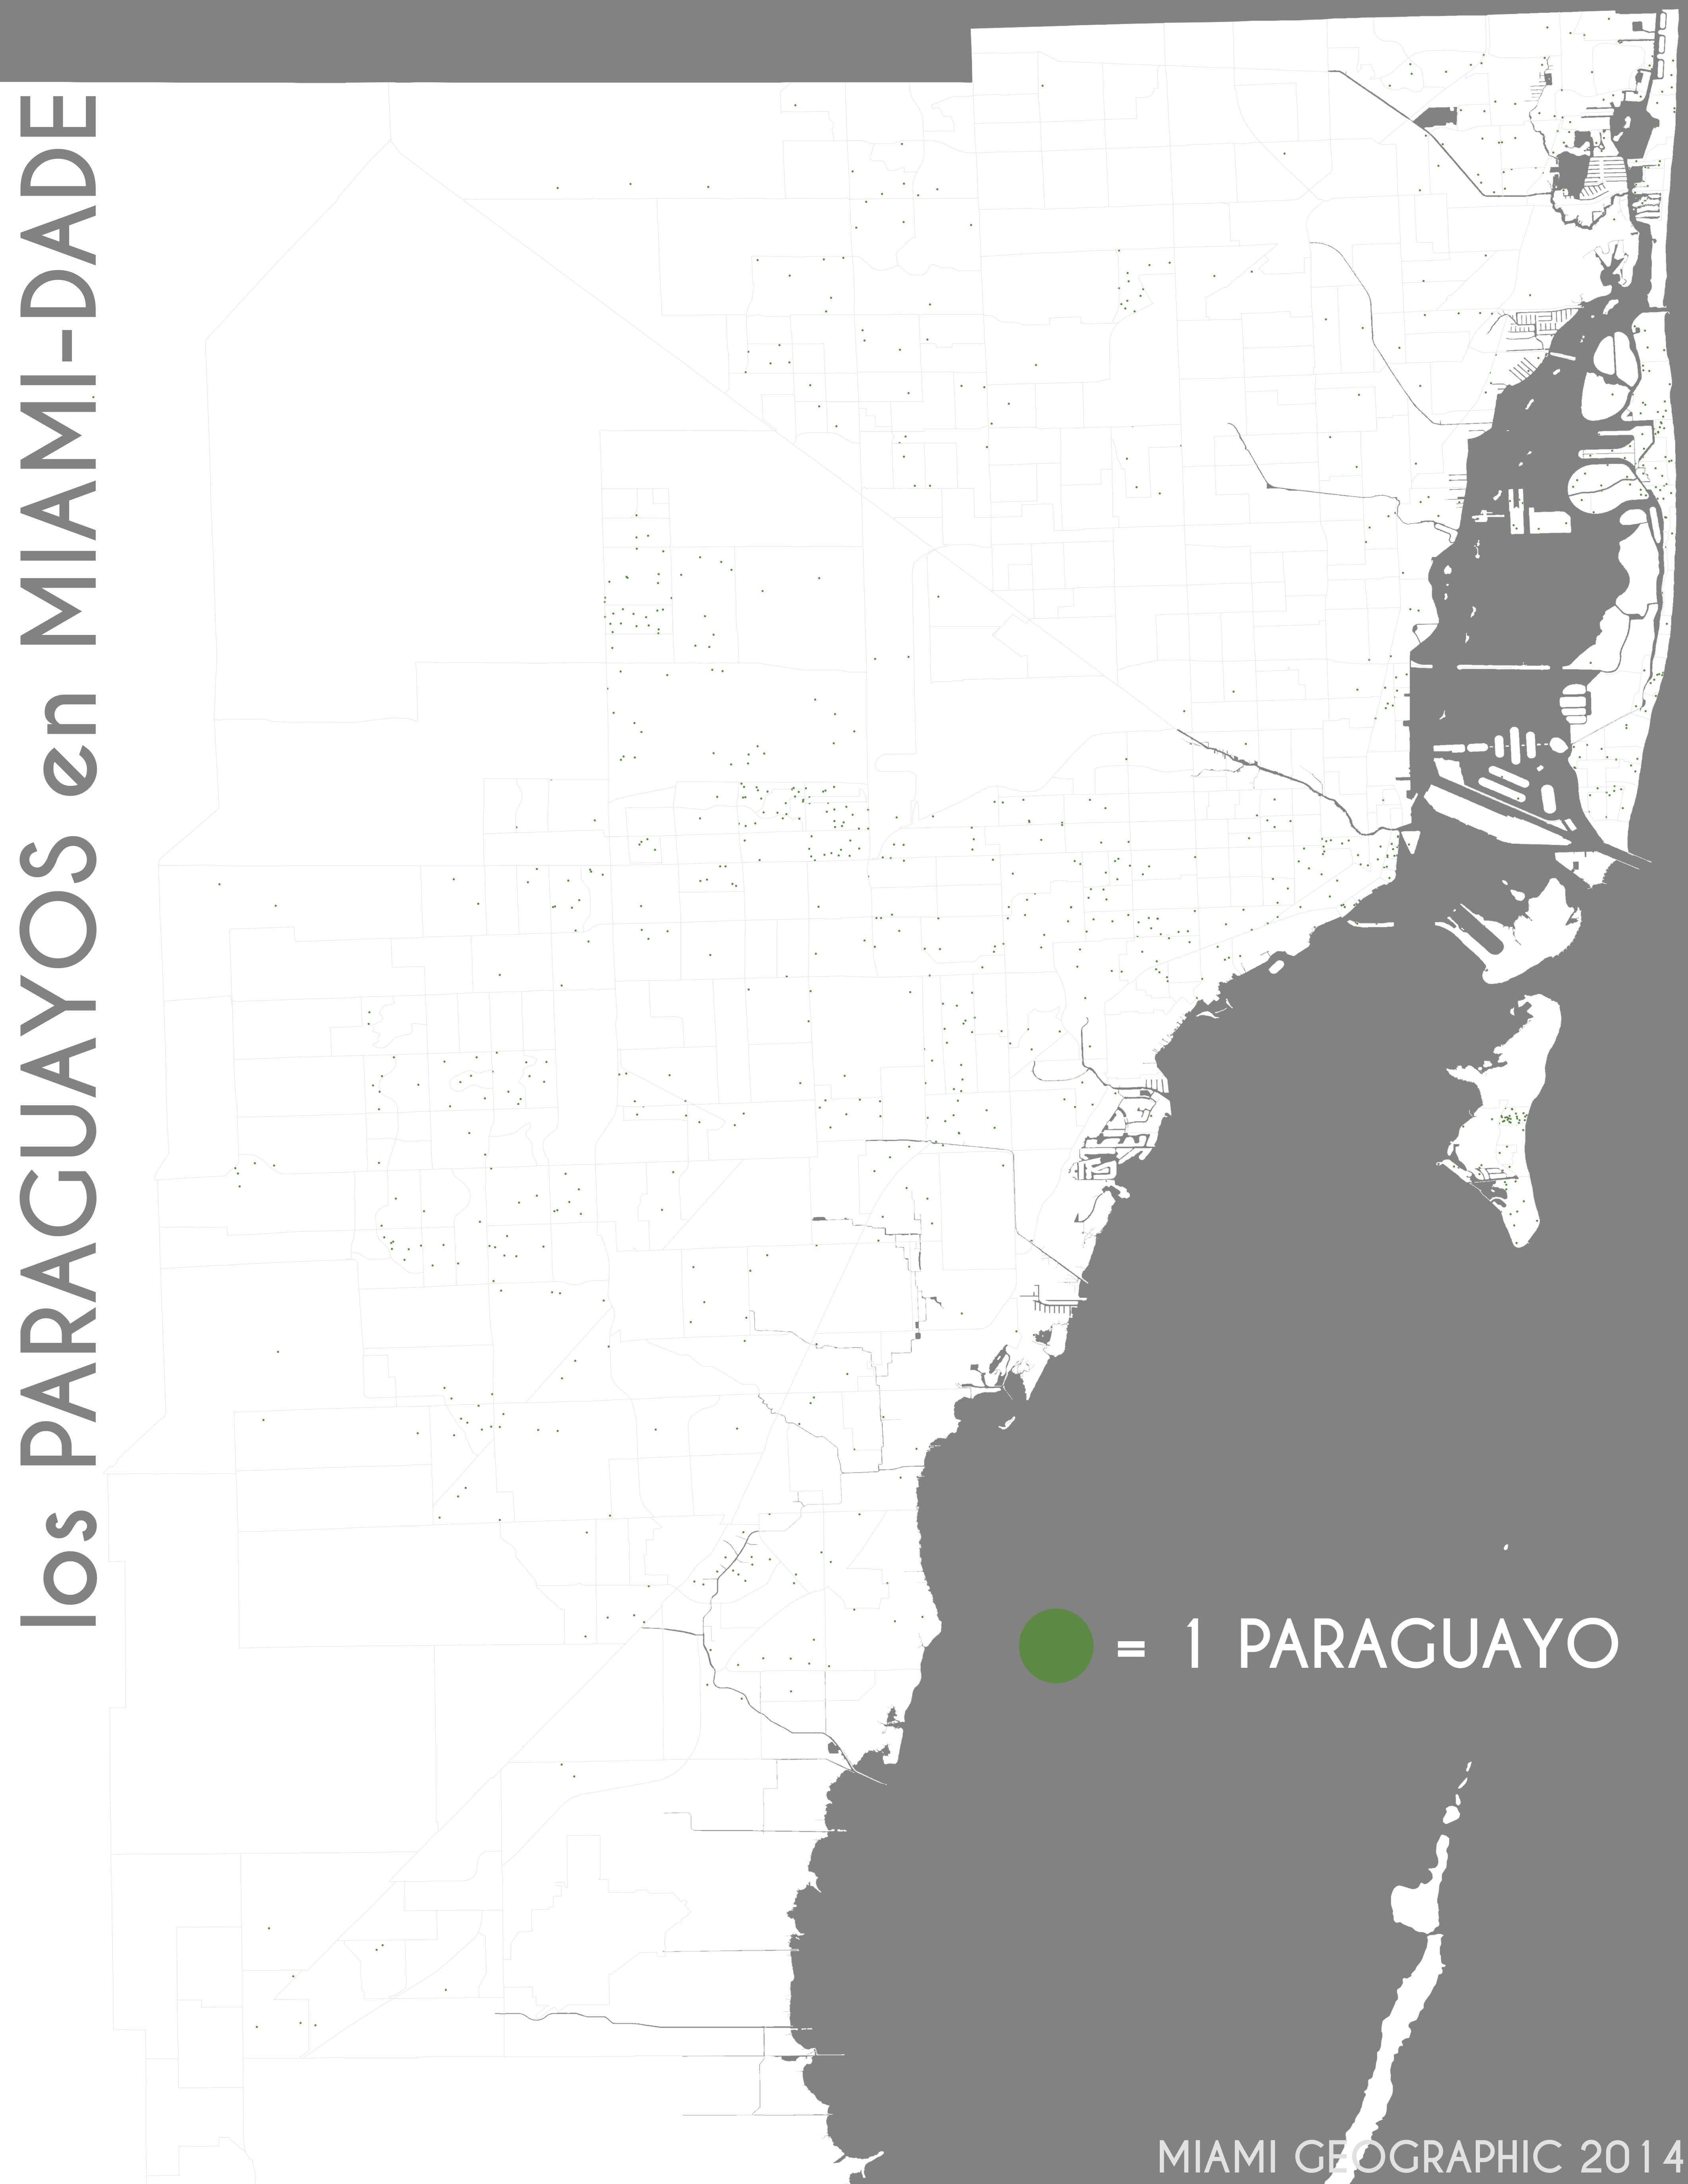
Los paraguayos en Miami-Dade. Data Source: 2010 Decennial Census. Map Source: Matthew Toro. 2014.
Peruvians
Our Peruvian friends, however, aren’t holding back at all. They’re making their presence felt in areas all over the county. You’ll find the largest pocket in the far southwest, though.

Los peruanos en Miami-Dade. Data Source: 2010 Decennial Census. Map Source: Matthew Toro. 2014.
Puerto Ricans
Puerto Ricans are pretty much all over the place, just not as much as Cubans.
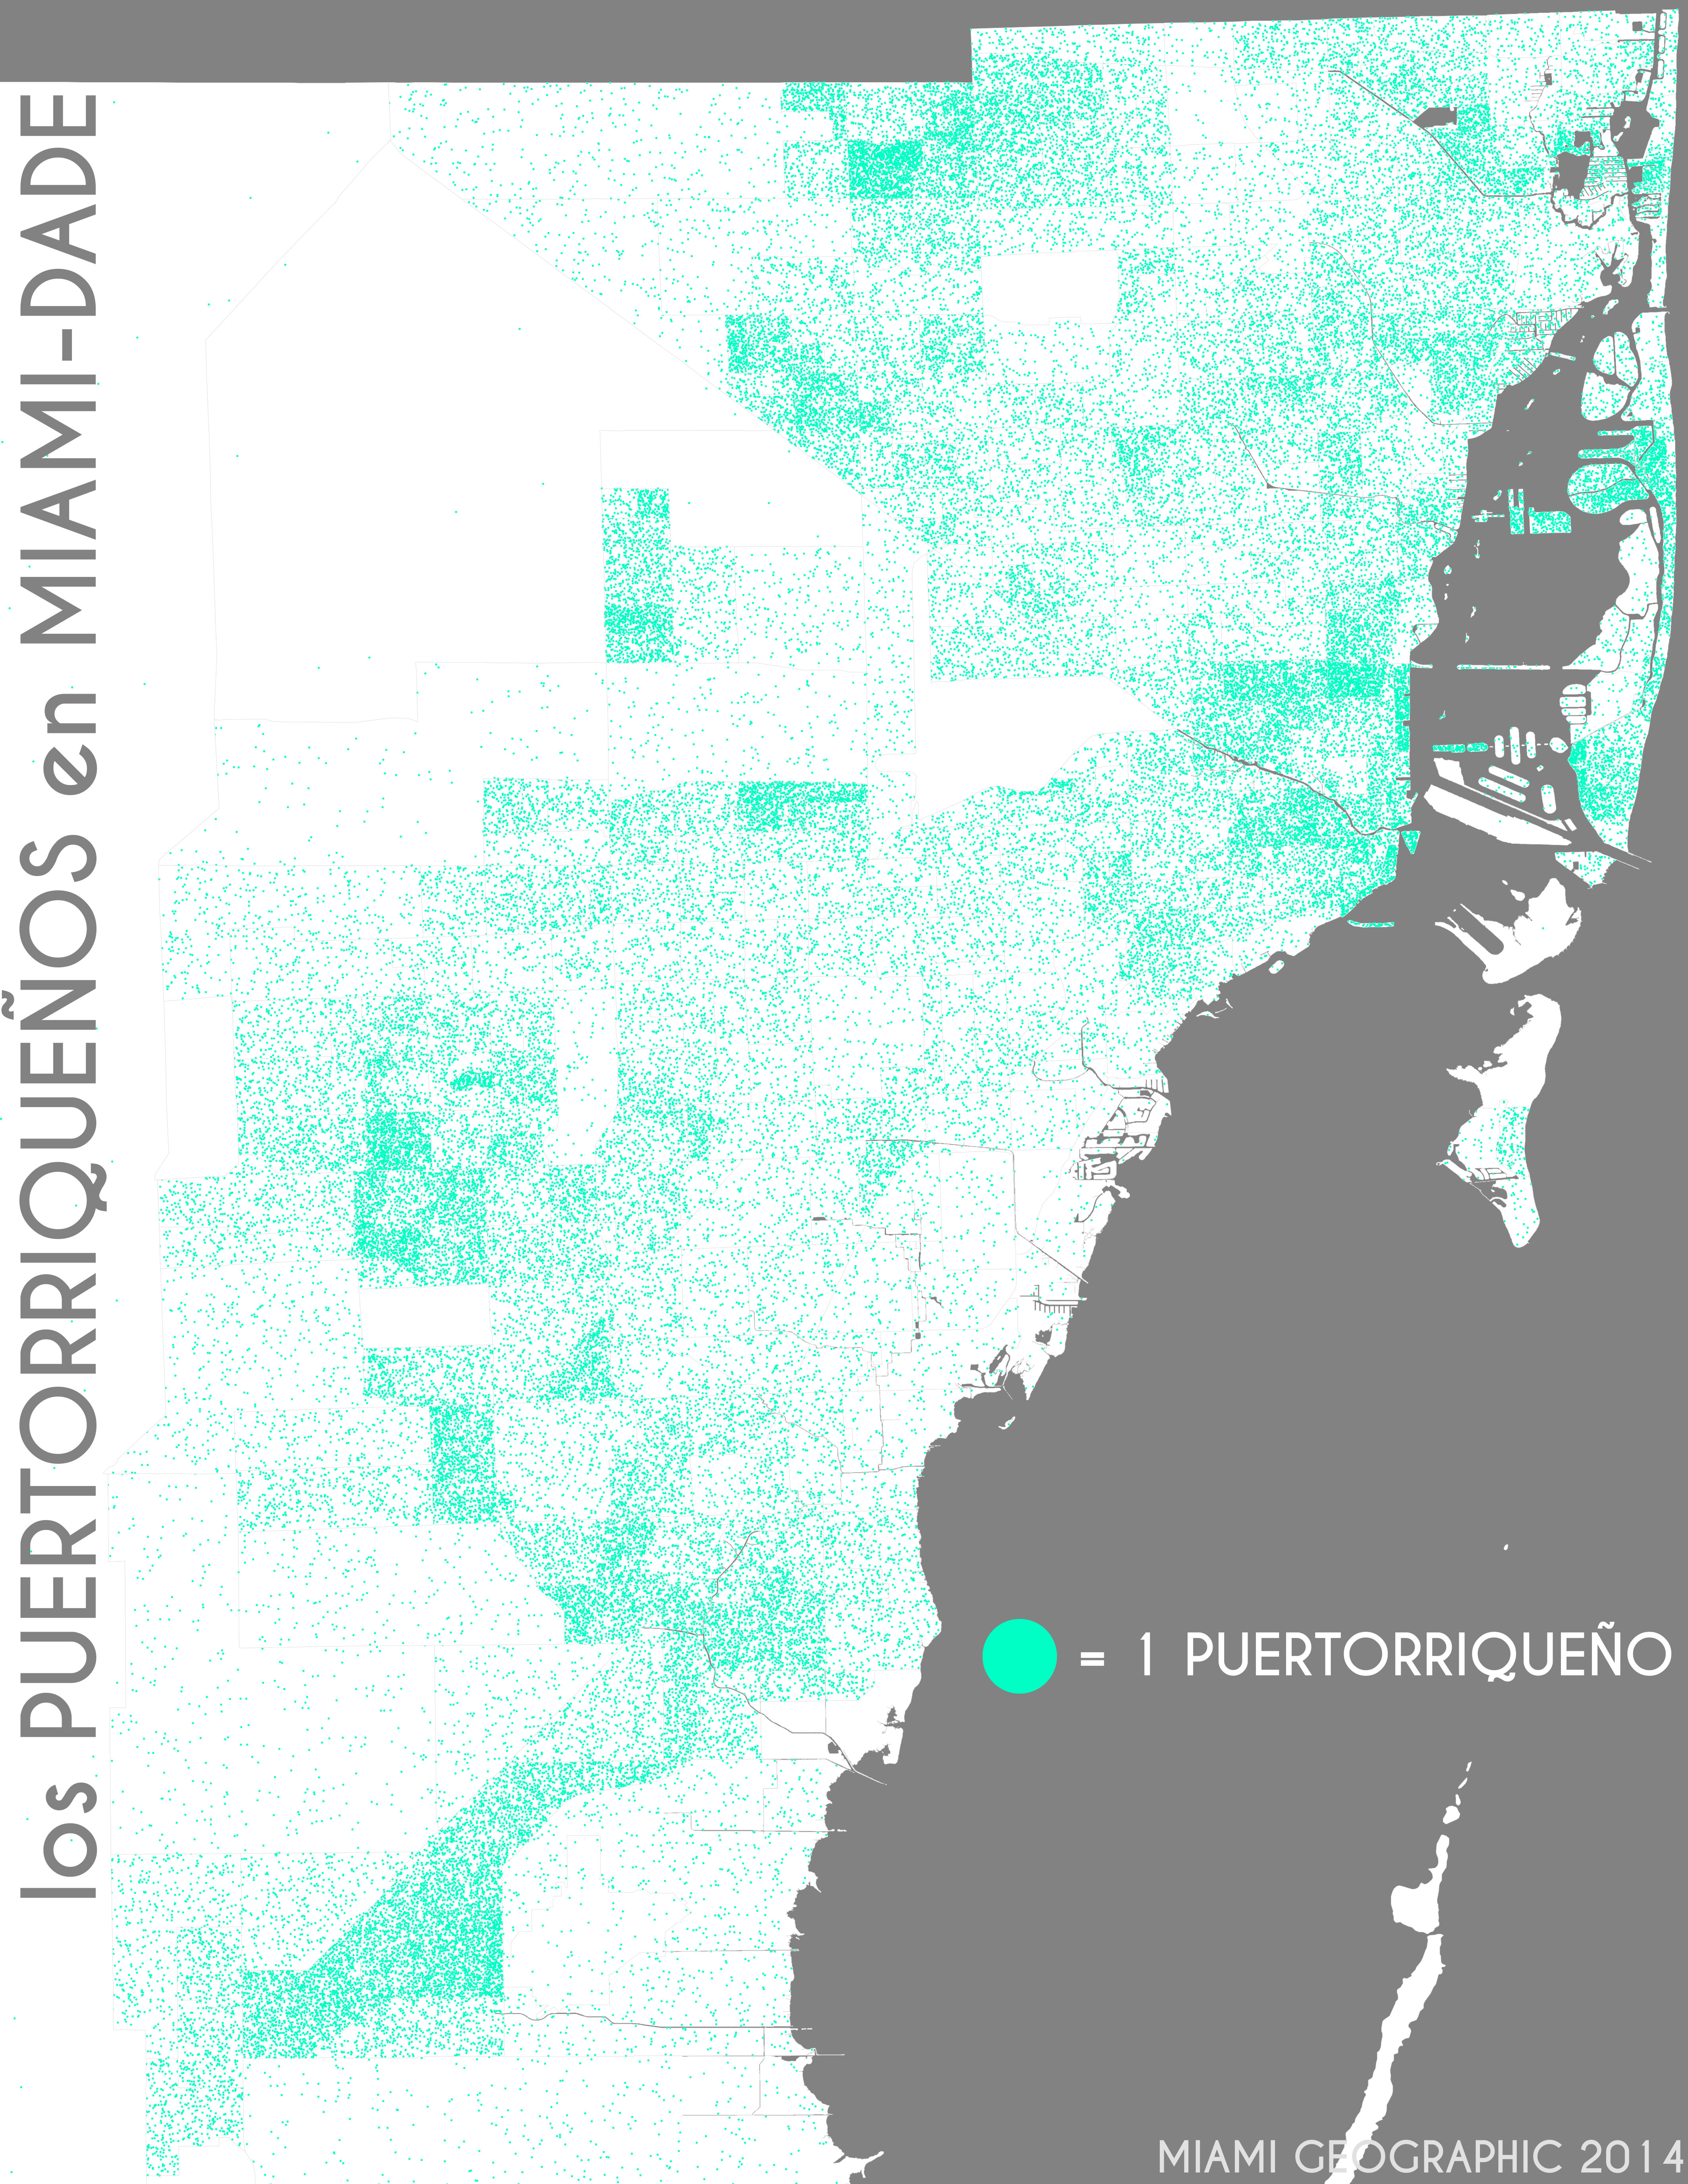
Los puertorriqueños en Miami-Dade. Data Source: 2010 Decennial Census. Map Source: Matthew Toro. 2014.
Salvadorans
Salvadorans like Little Havana.

Los salvadoreños en Miami-Dade. Data Source: 2010 Decennial Census. Map Source: Matthew Toro. 2014.
Uruguayans
Uruguayans are scattered quite sparsely throughout the county too, although there’s a good-sized community of them in north Miami Beach.
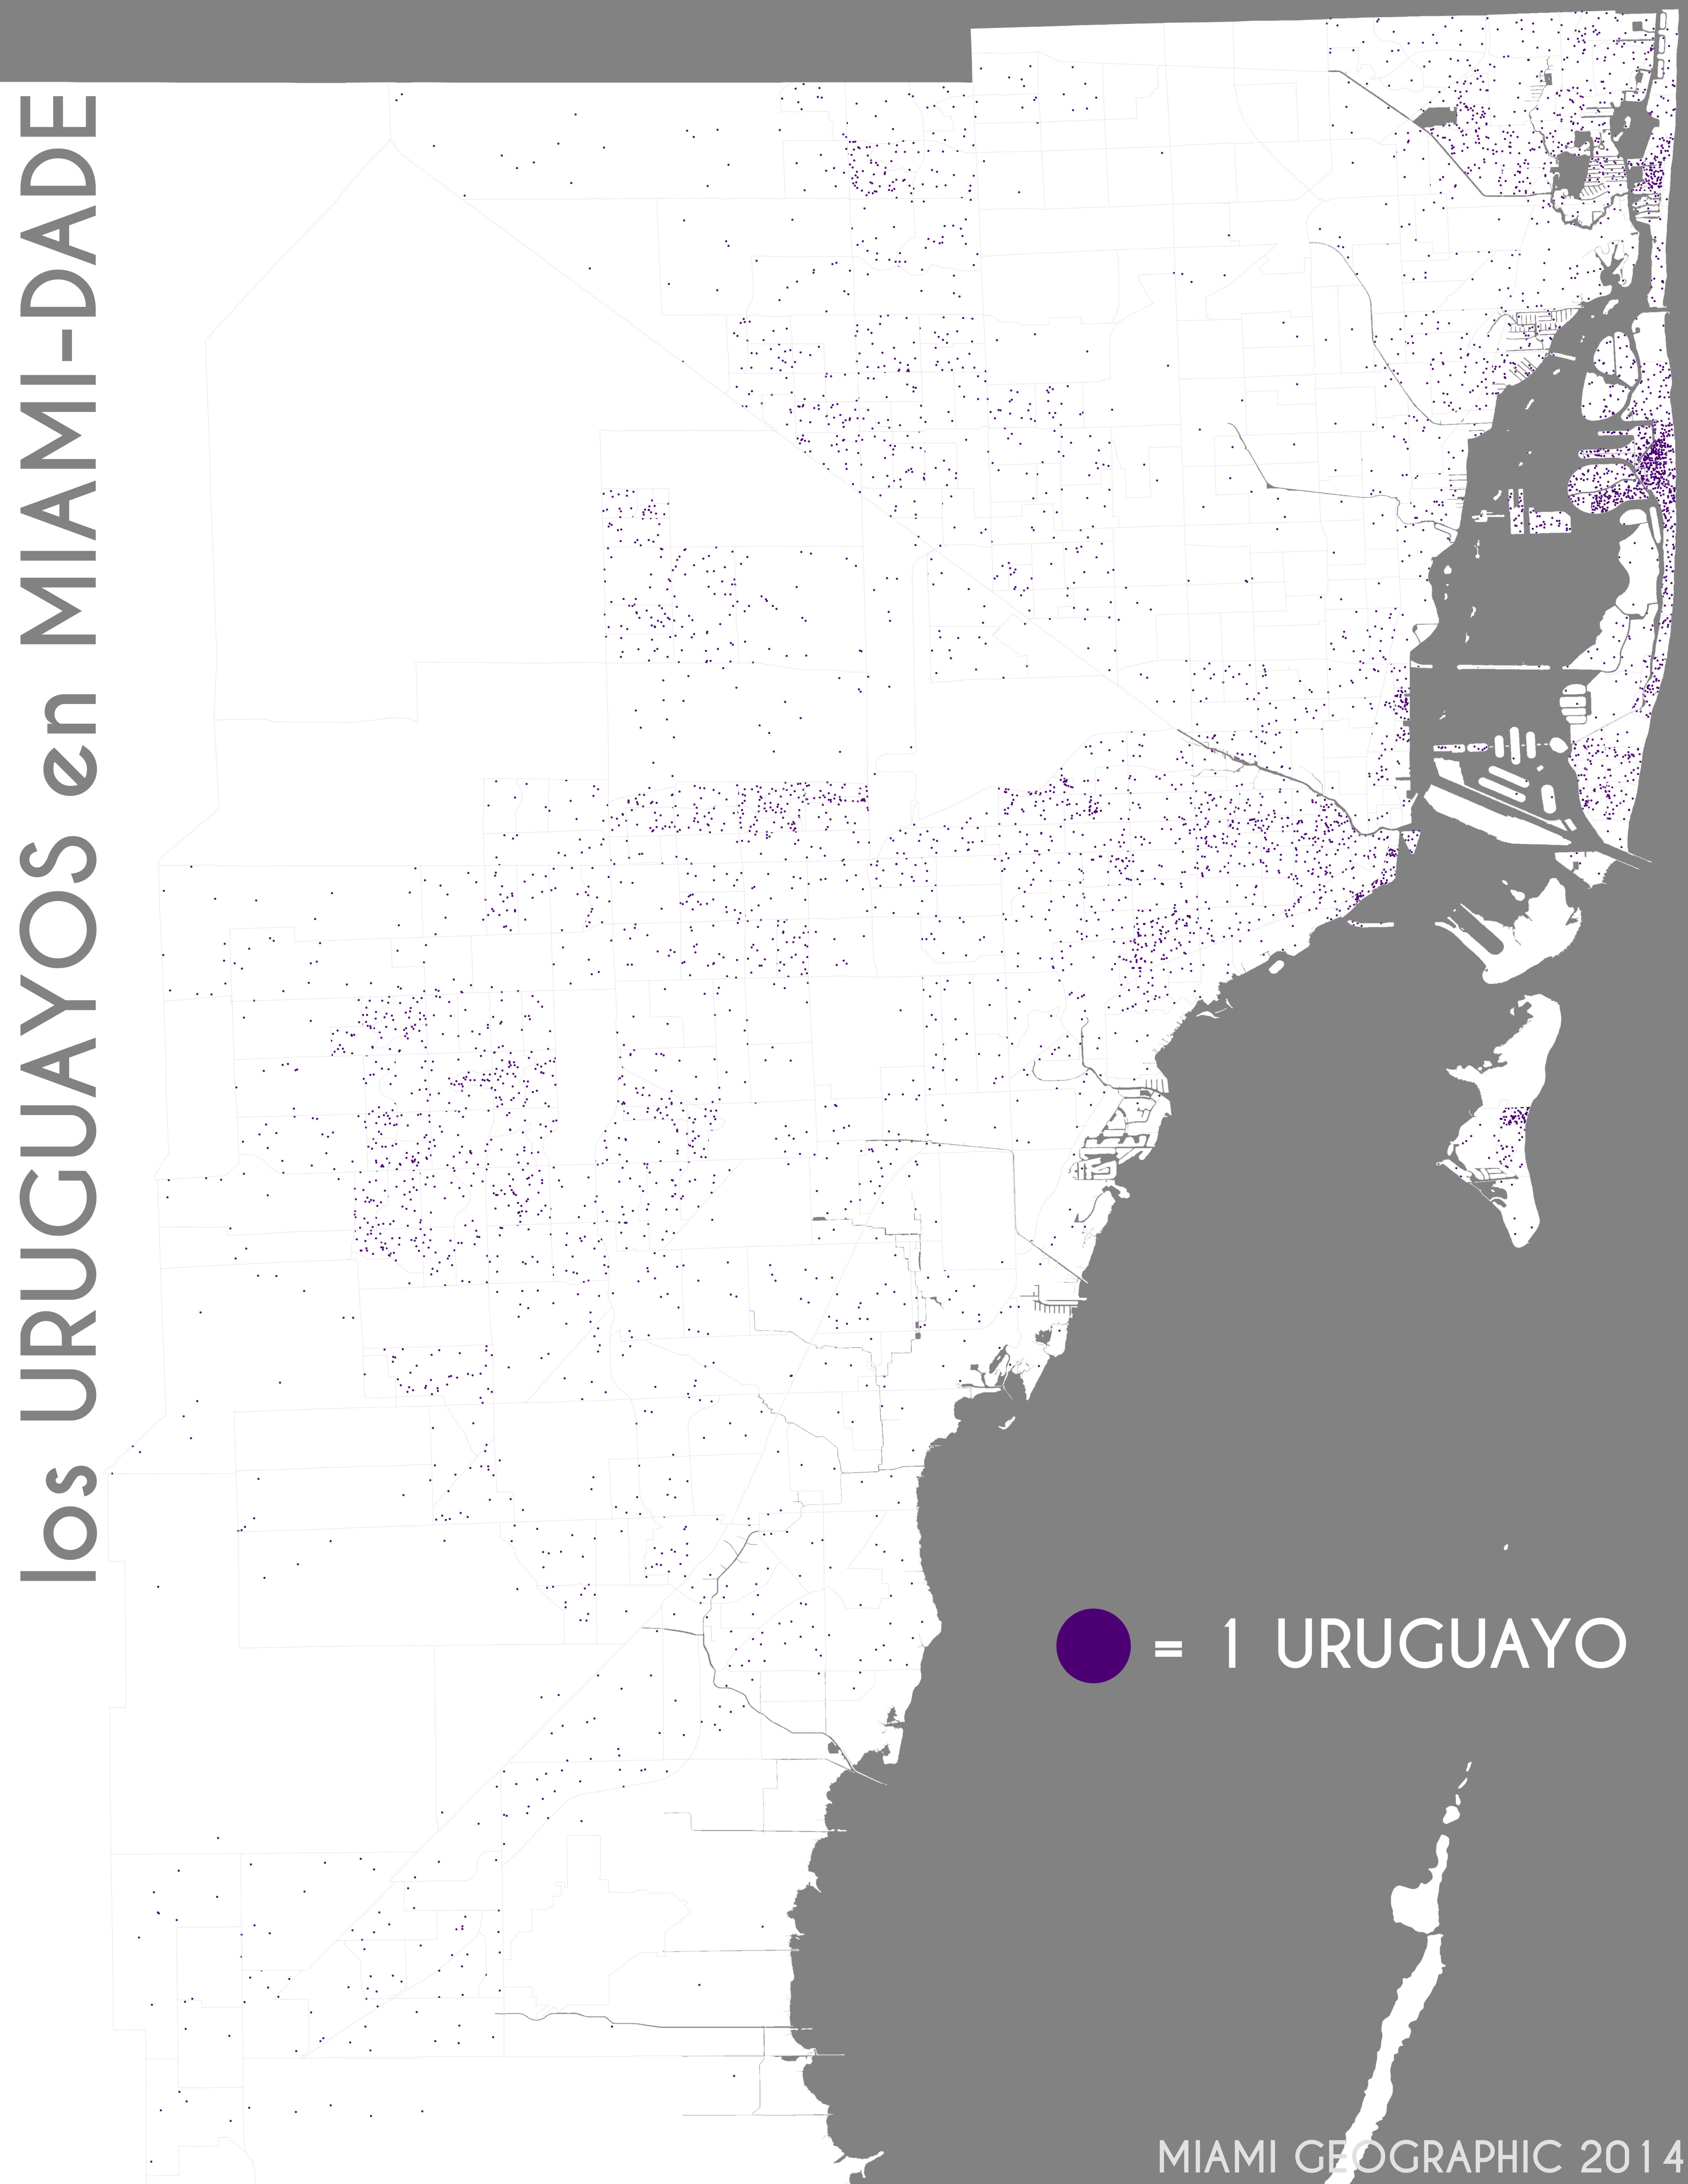
Los uruguayos en Miami-Dade. Data Source: 2010 Decennial Census. Map Source: Matthew Toro. 2014.
Venezuelans
Venezuelans have found their home in Doral, downtown Miami, and Aventura, with a relatively strong distribution in the southwest, as well as on Key Biscayne.
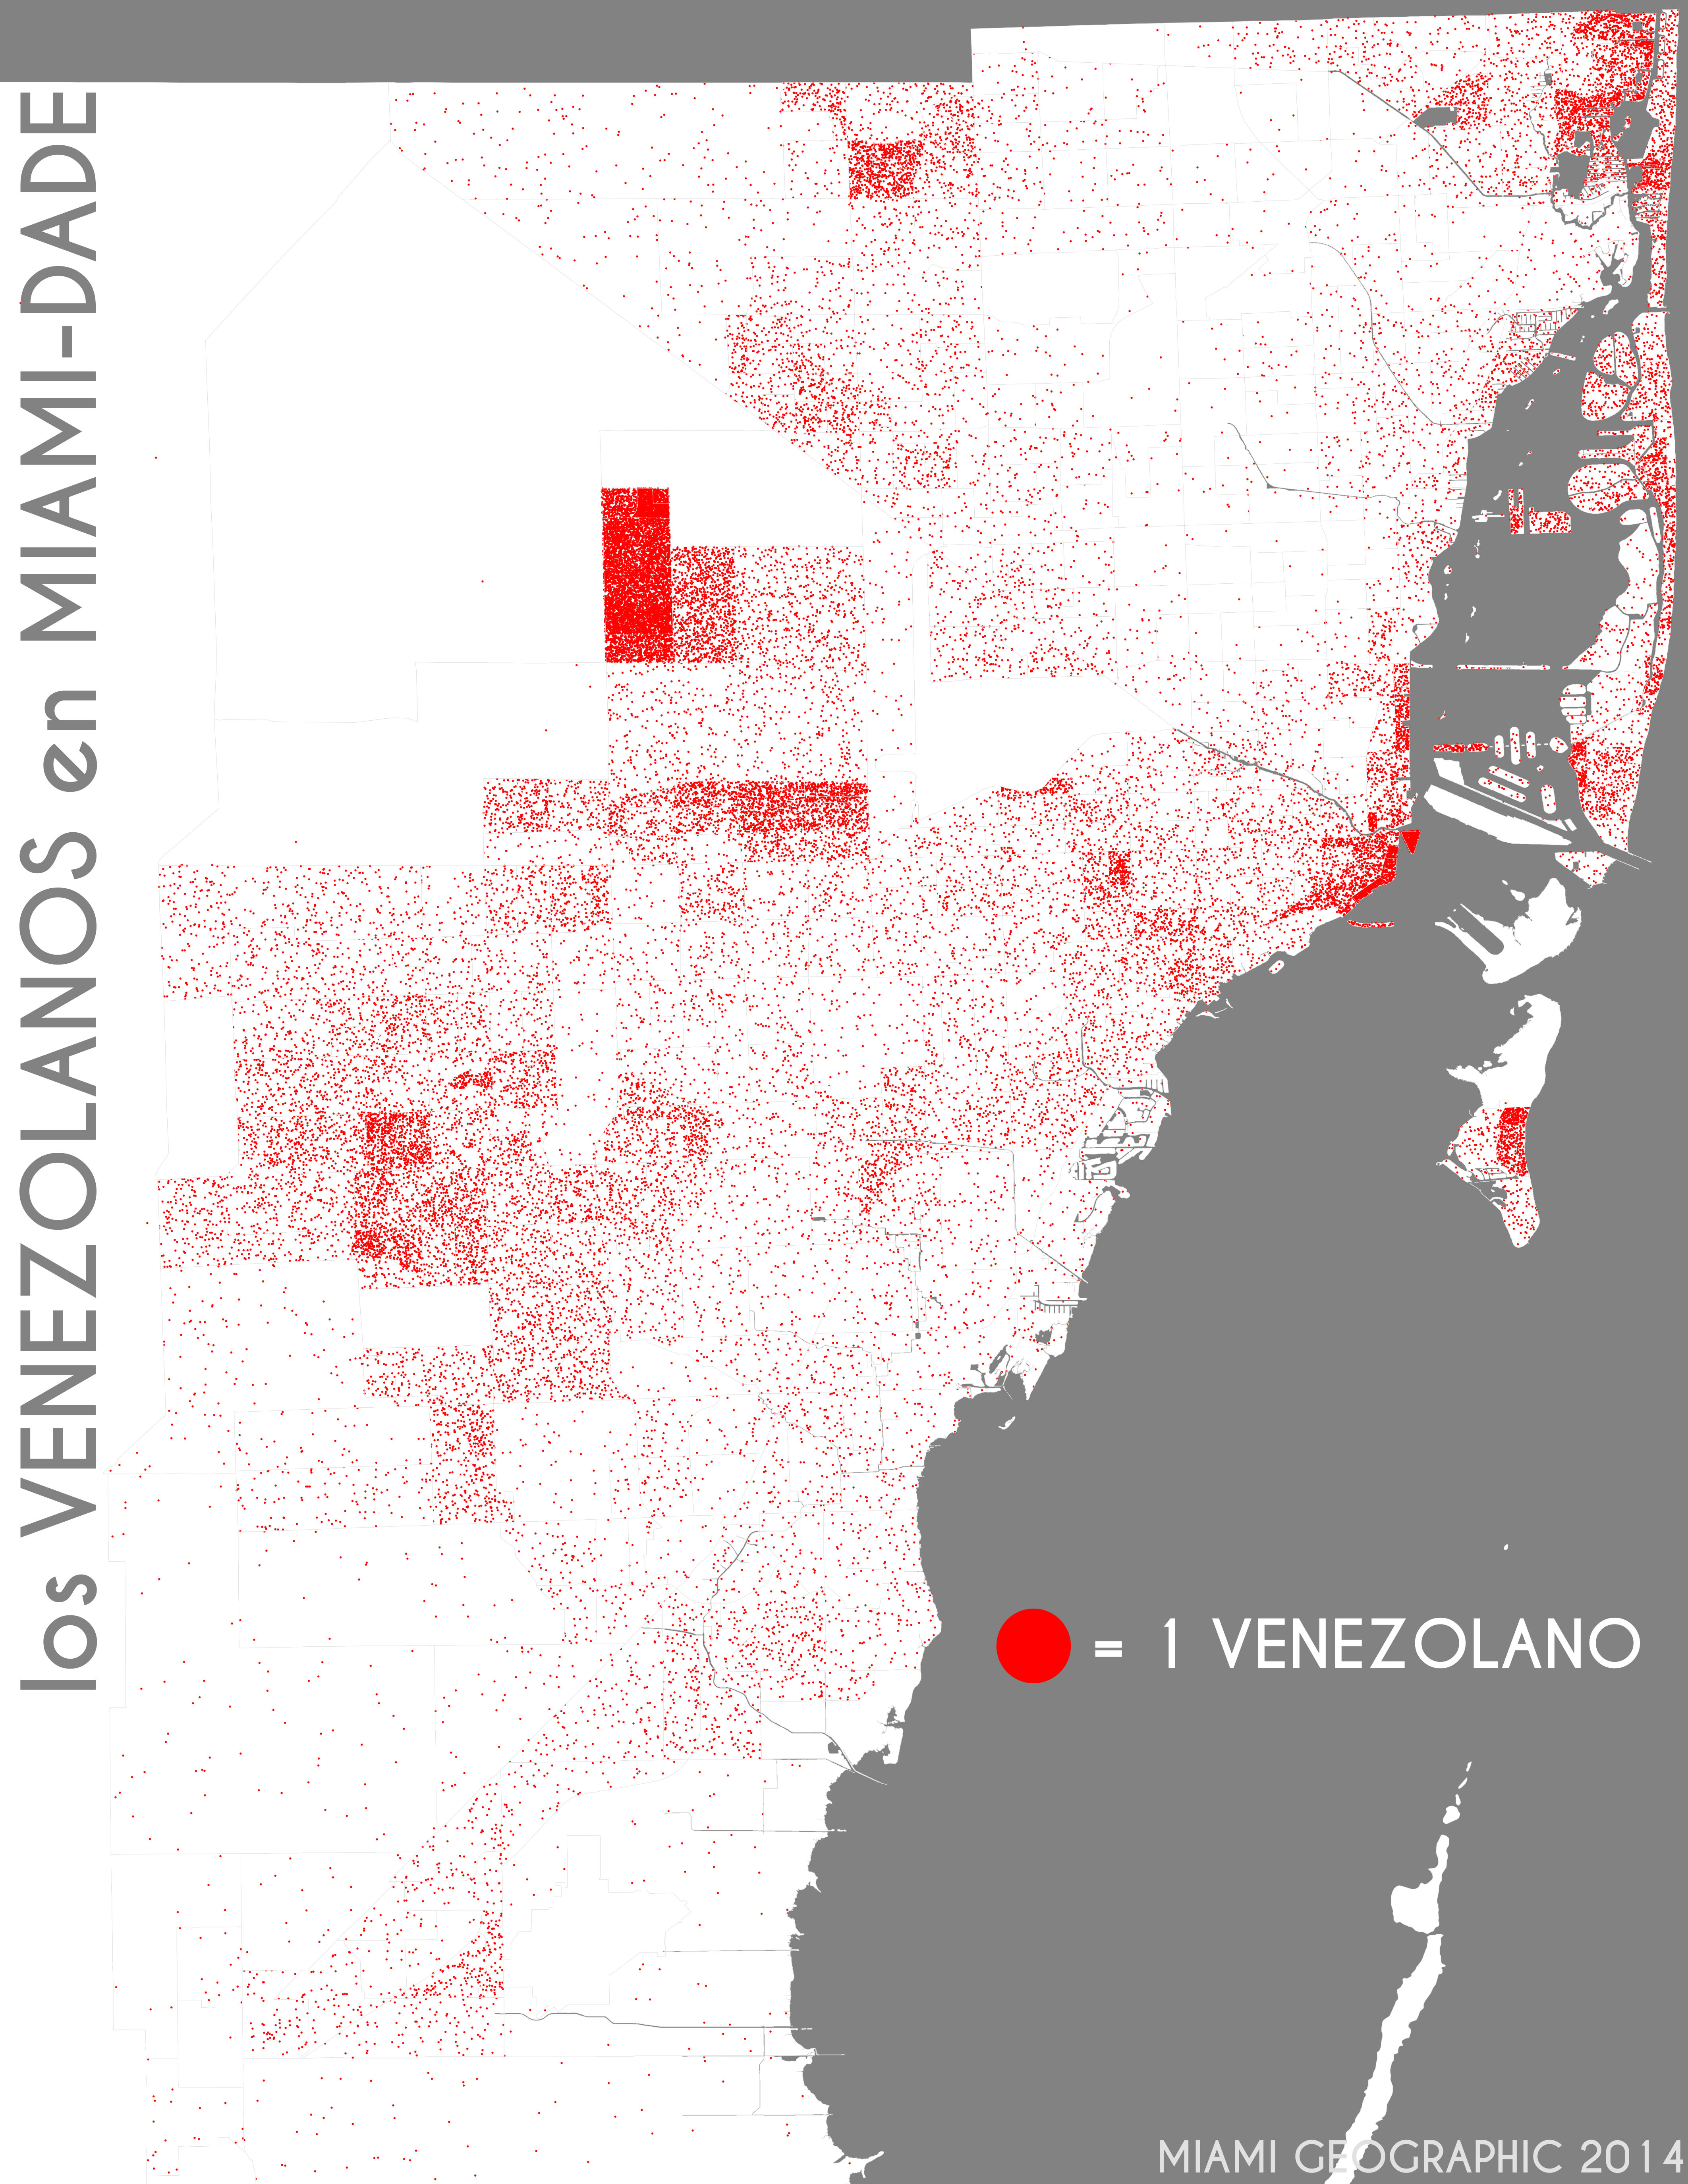
Los venezolanos en Miami-Dade. Data Source: 2010 Decennial Census. Map Source: Matthew Toro. 2014.
DATA SOURCE:
U.S. Census Bureau. (2010). Census Summary File 1. Table QT-P10, “Hispanic or Latino Origin”. American FactFinder.
Full documentation on variables used — “Hispanic or Latino Origin” — can be found in the US Census Bureau’s 2010 SF-1 Technical Documentation, on pages 637-638.

Pingback: The Hispanic Community Of Miami | Myhomeworkpro·
Pingback: The Hispanic Community of Miami - Assignmentheights·
Pingback: The Hispanic Community of Miami - Goodresearchessay·
Pingback: The Hispanic Community of Miami - healthcareprodigy·
Pingback: The Hispanic Community of Miami - writingcrik·
Pingback: The Hispanic Community of Miami - domyassignments123·
Pingback: What We Know About How White and Latino Americans Voted In 2020 - Pre Chewed·
Pingback: How The 2020 Election Changed The Electoral Map | FiveThirtyEight·
Pingback: How The 2020 Election Changed The Electoral Map - Genesis Brand·
Pingback: How The 2020 Election Changed The Electoral Map – Anonymous Black·
Pingback: How The 2020 Election Changed The Electoral Map - Republican Win Daily·
Pingback: What We Know About How White and Latino Americans Voted In 2020 – Power Polls·
Pingback: What We Know About How White and Latino Americans Voted In 2020 – Politixia·
Pingback: What We Know About How White and Latino Americans Voted In 2020 – Anonymous Black·
Pingback: What We Know About How White and Latino Americans Voted In 2020 – My Blog·
Pingback: What We Know About How White and Latino Americans Voted In 2020 - POLITICS MAGAZINE·
Pingback: What We Know About How White and Latino Americans Voted In 2020 - iNFO Vi·
Pingback: What We Know About How White and Latino Americans Voted In 2020 - USVI News·
Pingback: What We Know About How White and Latino Individuals Voted In 2020 | Metrump·
Pingback: What We Know About How White and Latino Americans Voted In 2020 - Genesis Brand·
Pingback: What We Know About How White and Latino Americans Voted In 2020 – Politics·
Pingback: What We Know About How White and Latino Americans Voted In 2020 | FiveThirtyEight·
Pingback: What We Know About How White and Latino Americans Voted In 2020 – Bonewar·
True………..
great lol
Pingback: ¿Es un problema la alta desigualdad en Miami? – Adribosch's Blog·
Pingback: Miami Is Highly Unequal-But Is That Bad? - MorningStandard.com·
Can’t wait to see how the data presents itself after the next census in 2020. Have you looked at prior census data to see what the movement of peoples shows?
Great question, Duane Marble. As seen in the “Data Source” section at the bottom of the post, data came from the 2010 decennial census. These data correspond to census tract data. If you look closely at each map, you’ll see the faint grey lines delimiting each of the Miami-Dade County census tracts. Each dot represents a single person in each ethno-national group for that census tract.
What was the cartographic basis for the placement of the individual dots on the map? The Census provides only small area totals.
And this is why the butcher shop at the Presidente (used to be Food Giant) on the 79th St. Causeway is the place for S. American cuts of meat.
Great article!
“Miami Lakes area” is really the Hialeah area. I’m kind of surprised on how diverse West Hialeah and that NW area has become.
Bruno L. — https://miamigeographic.com/2014/04/23/fabricado-no-brasil/
How about us Brazilians? We don’t speak Spanish but we are Latinos too!
Simply amazing. Some groups have certain concentrations while others are spread out, though maintaining areas of dominance.