Today we’re looking at the network of urbanized areas in the United States, including Miami, and how they compare to one another in terms of population.
The following maps illustrate the distribution of what the US Census Bureau refers to as both “urban clusters” and “urban areas” throughout the country.
- Urban clusters contain between 2,500 and 49,999 people within their boundaries.
- Urbanized areas contain 50,000 or more people within their boundaries.
For the sake of simplicity, we’ll call every Census-defined unit containing more than 2,500 people (meaning both urban clusters and urbanized areas) an “urban area”.
When viewed in its entirety, the network of urban areas in the (contiguous) United States seems to mimic a constellation of stars, in configurations of varying degrees of intensity as one moves through the different regions of US space.
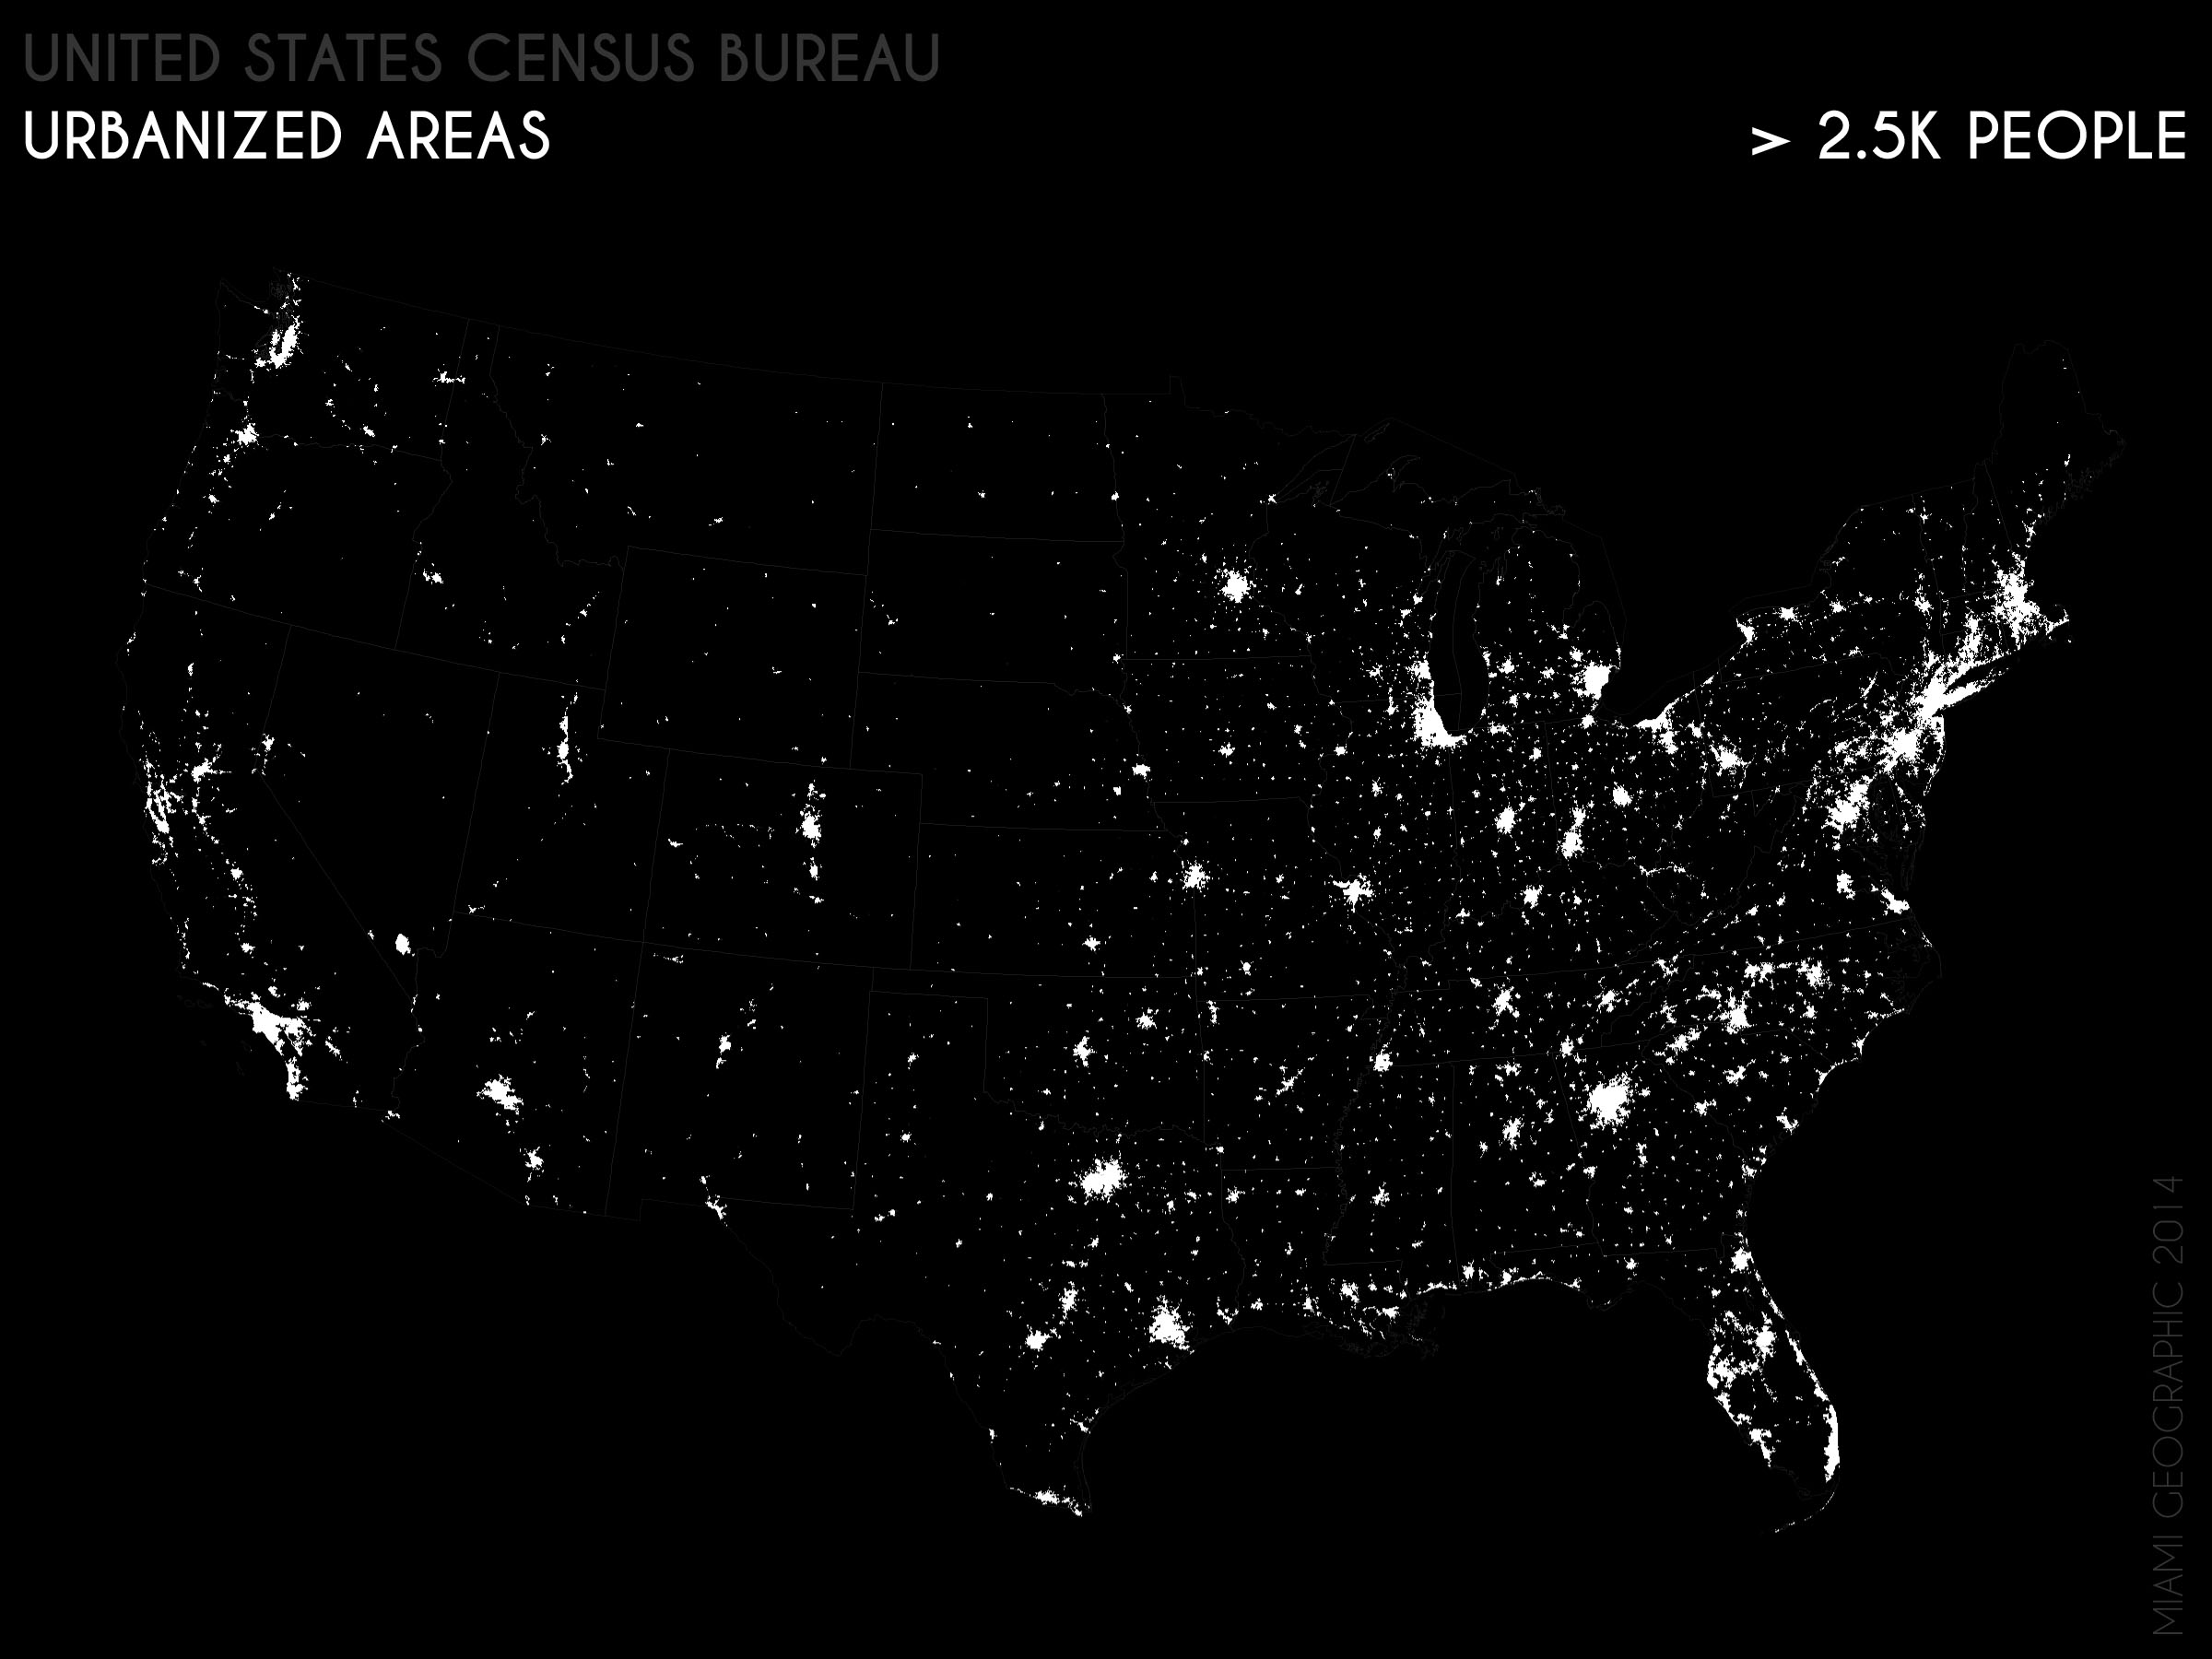
Urbanized Areas (>2.5K People, Complete), 2010. Data Source: US Census Bureau, 2010 Decennial Census. Map Source: Matthew Toro. 2014.
The Census Bureau’s urban areas dataset bears an unsurprising resemblance to the popular “earth at night” satellite image composites regularly stitched-together by NASA. The latter, of course, casts a lot more light, as the Census Bureau’s data includes only those areas containing at least 2,500 persons, effectively turning-off the lights on many of the United States’ smallest population centers, especially those east of the Great Plains.
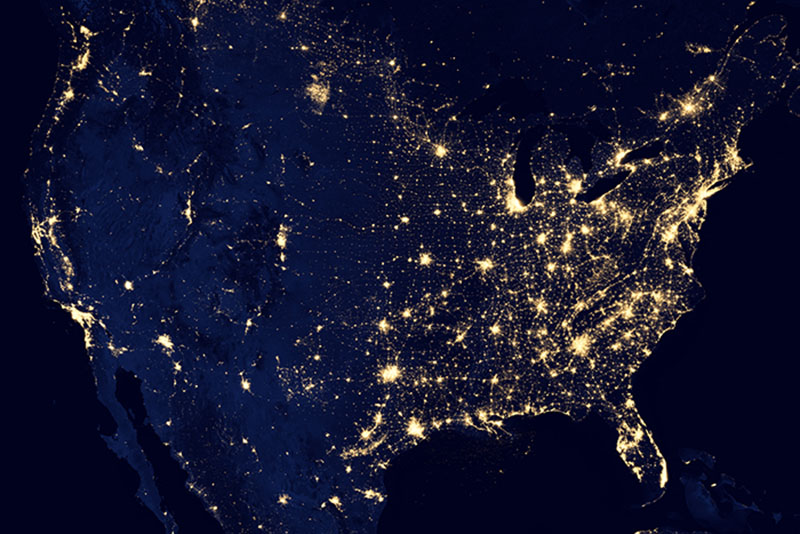
Contiguous US at Night, 2012. Data & Map Source: NASA Earth Observatory/NOAA NGDC. December 5, 2012.
Breaking-up the dataset into different population groupings, the US urban system becomes illuminated in new ways.
The entire dataset contains a total of 3,592 urban areas, ranging from the Lake Rancho Viejo, California urban cluster (2,500 people) to the megalopolis centered on New York (18,351,295 people).
Mind you: these population data come from the 2010 decennial census, so there has undoubtedly been growth in the number of people living in these places in the last few years.
I stratified the 2010 decennial census population of urban areas into seven classes:
- 2.5K – 500K (2,500 – 499,999) people
- 500K – 1M (500,000 – 999,999) people
- 1M – 2M (1,000,000 – 1,999,999) people
- 2M – 3M (2,000,000 – 2,999,999) people
- 3M – 5M (3,000,000 – 4,999,999) people
- 5M – 10M (5,000,000 – 9,999,999) people
- > 10M (greater than 10,000,000) people
The overwhelming majority of all US urban areas (3,512; nearly 98%) fall within the 2.5K – 500K class.
In this population range, we’re talking about small towns like Jasper, Texas (pop.: 7,790); Crossville, Tennessee (pop.: 16,337); Duncan, Oklahoma (pop.: 21,301); Asheboro, North Carolina (pop.: 37,792); and Twin Falls, Idaho (pop.: 48,836); all the way up through mid- and large-size US cities like Cheyenne, Wyoming (pop.: 783,588); Las Cruces, New Mexico (pop.: 128,600); Atlantic City, New Jersey (pop.: 248,402); Jackson, Mississippi (pop.: 351,478); and Madison, Wisconsin (pop.: 401,661).
Virtually all US population centers fall within the 2.5K – 500K range.
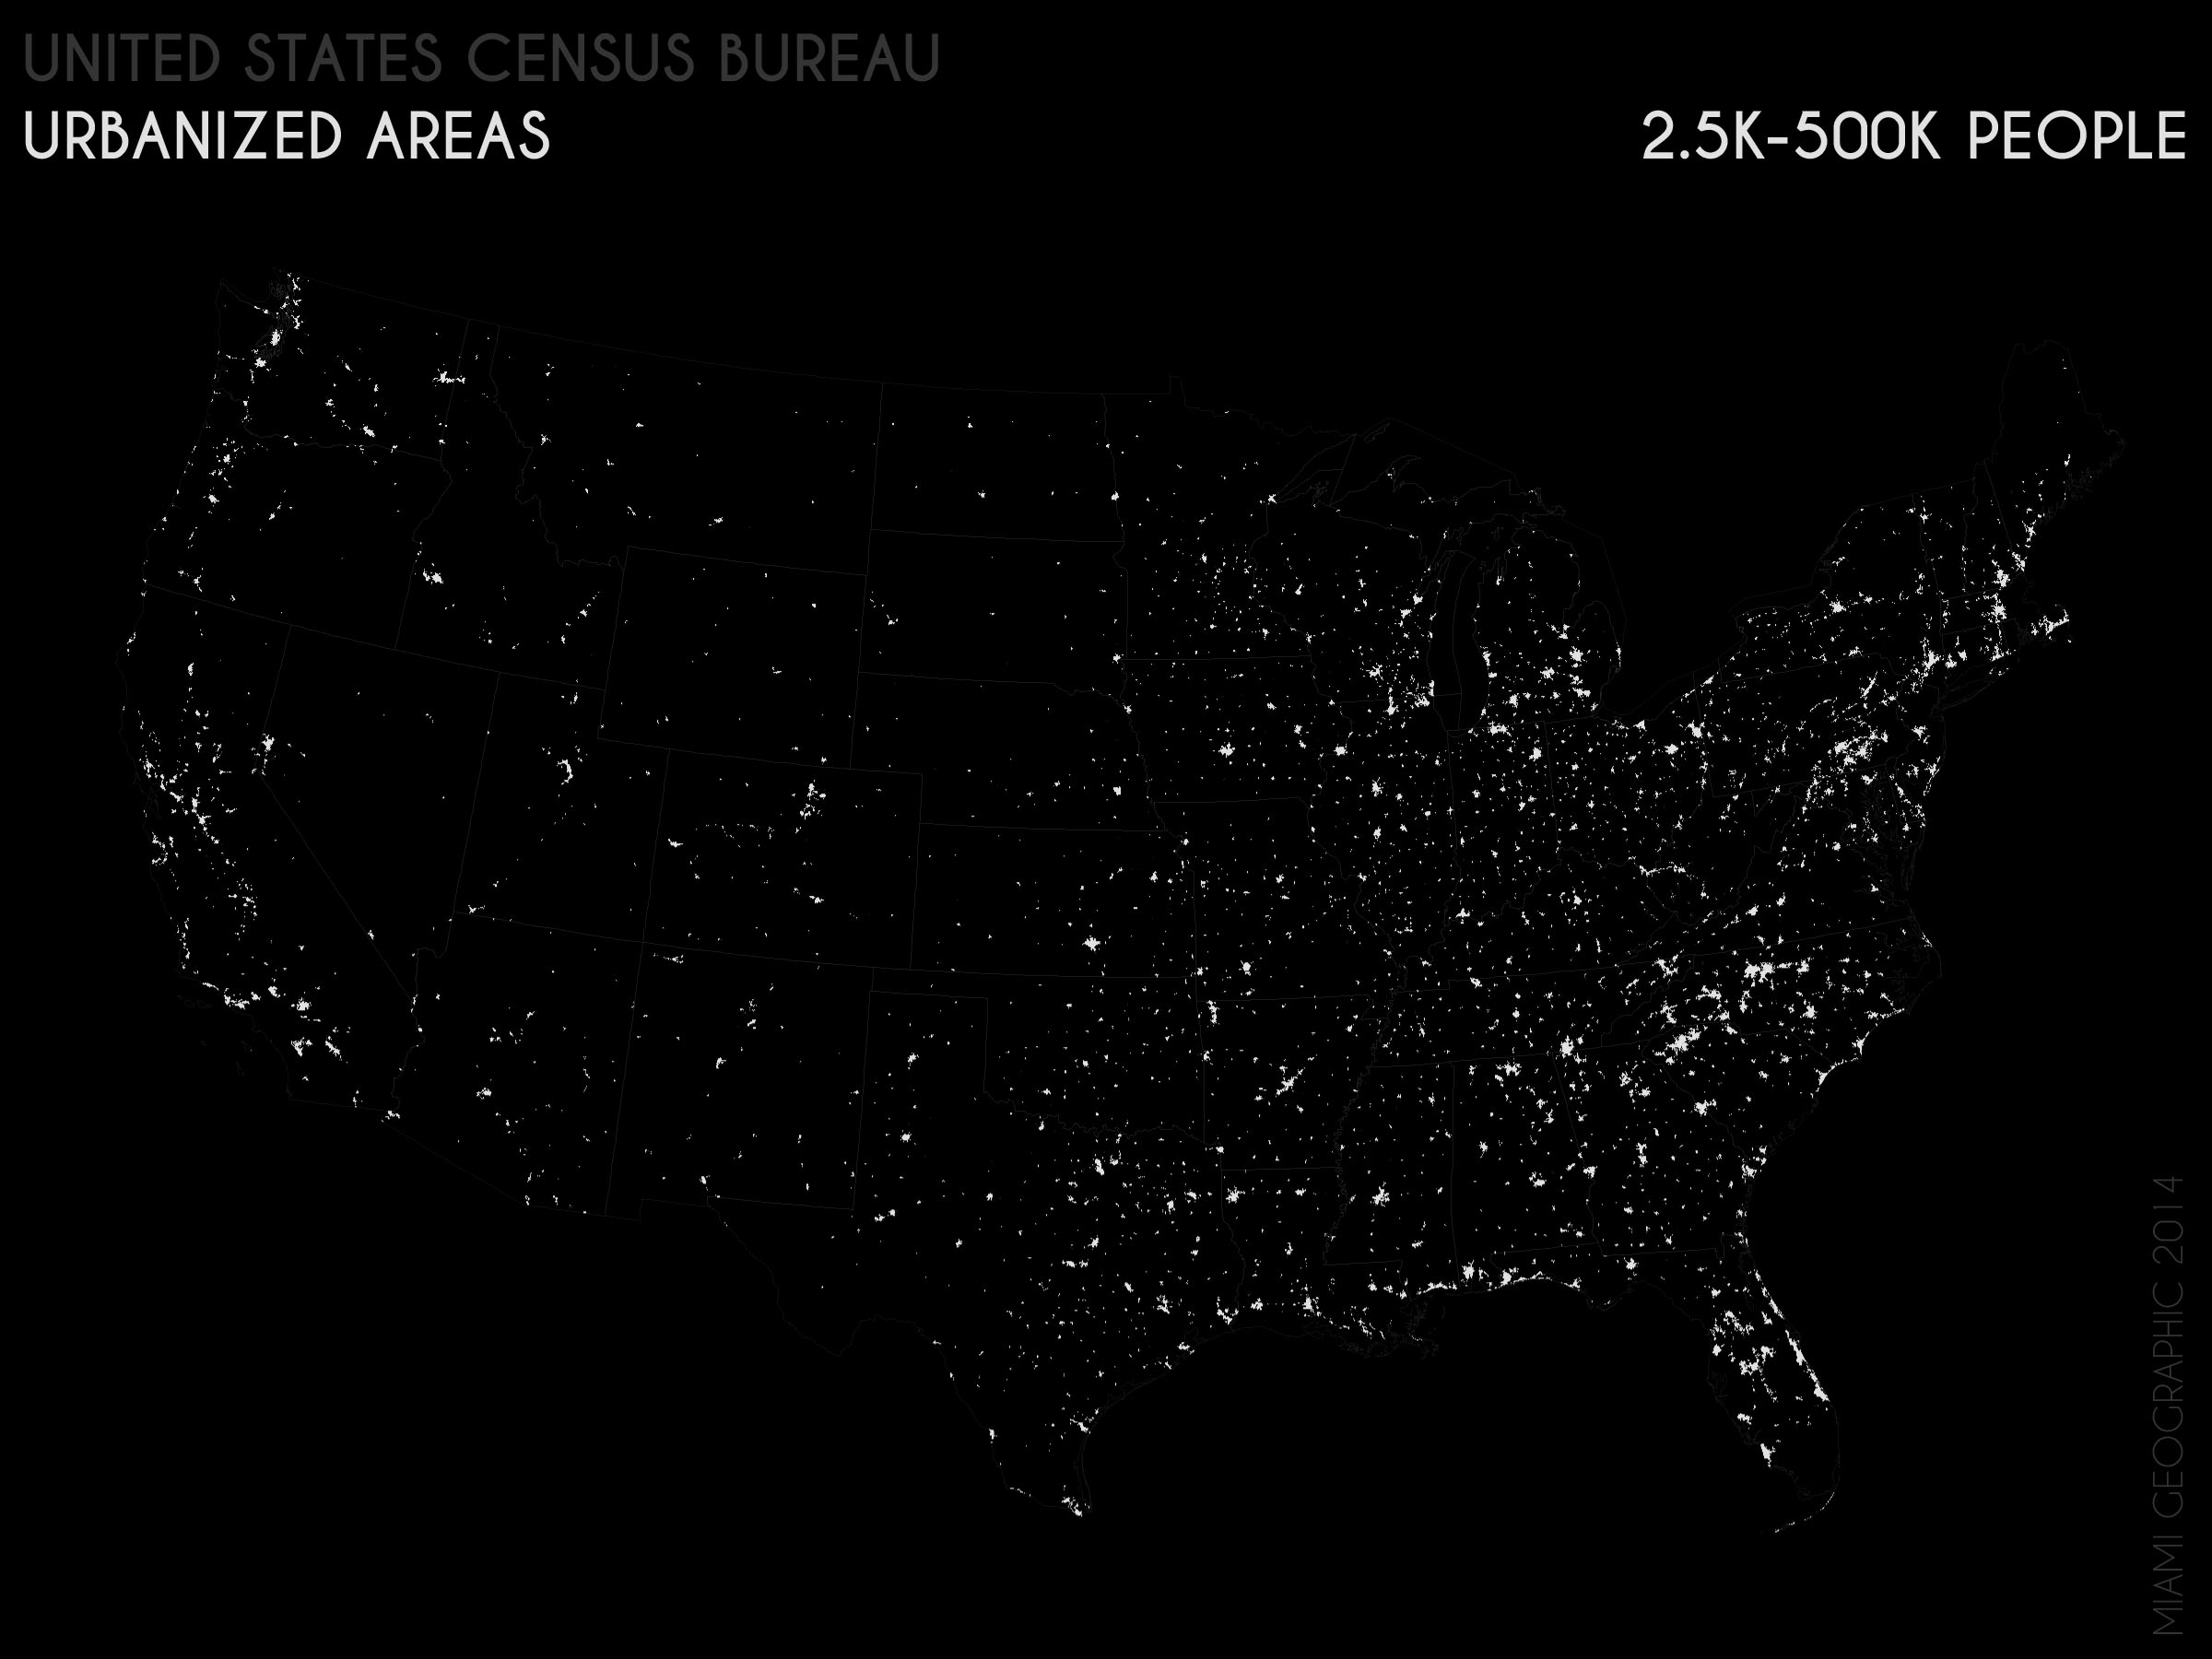
Urbanized Areas (2.5K-500K People), 2010. Data Source: US Census Bureau, 2010 Decennial Census. Map Source: Matthew Toro. 2014.
The number of stars in the constellation decreases significantly at the next population level delineated. There are only 38 urban areas in the 500K – 1M class.
The yellow stars in this category include places like Columbia, South Carolina (pop.: 549,777); Albany, New York (pop.: 594,962); Raleigh, North Carolina (pop.: 884,891); and Hartford, Connecticut (pop.: 924,859).
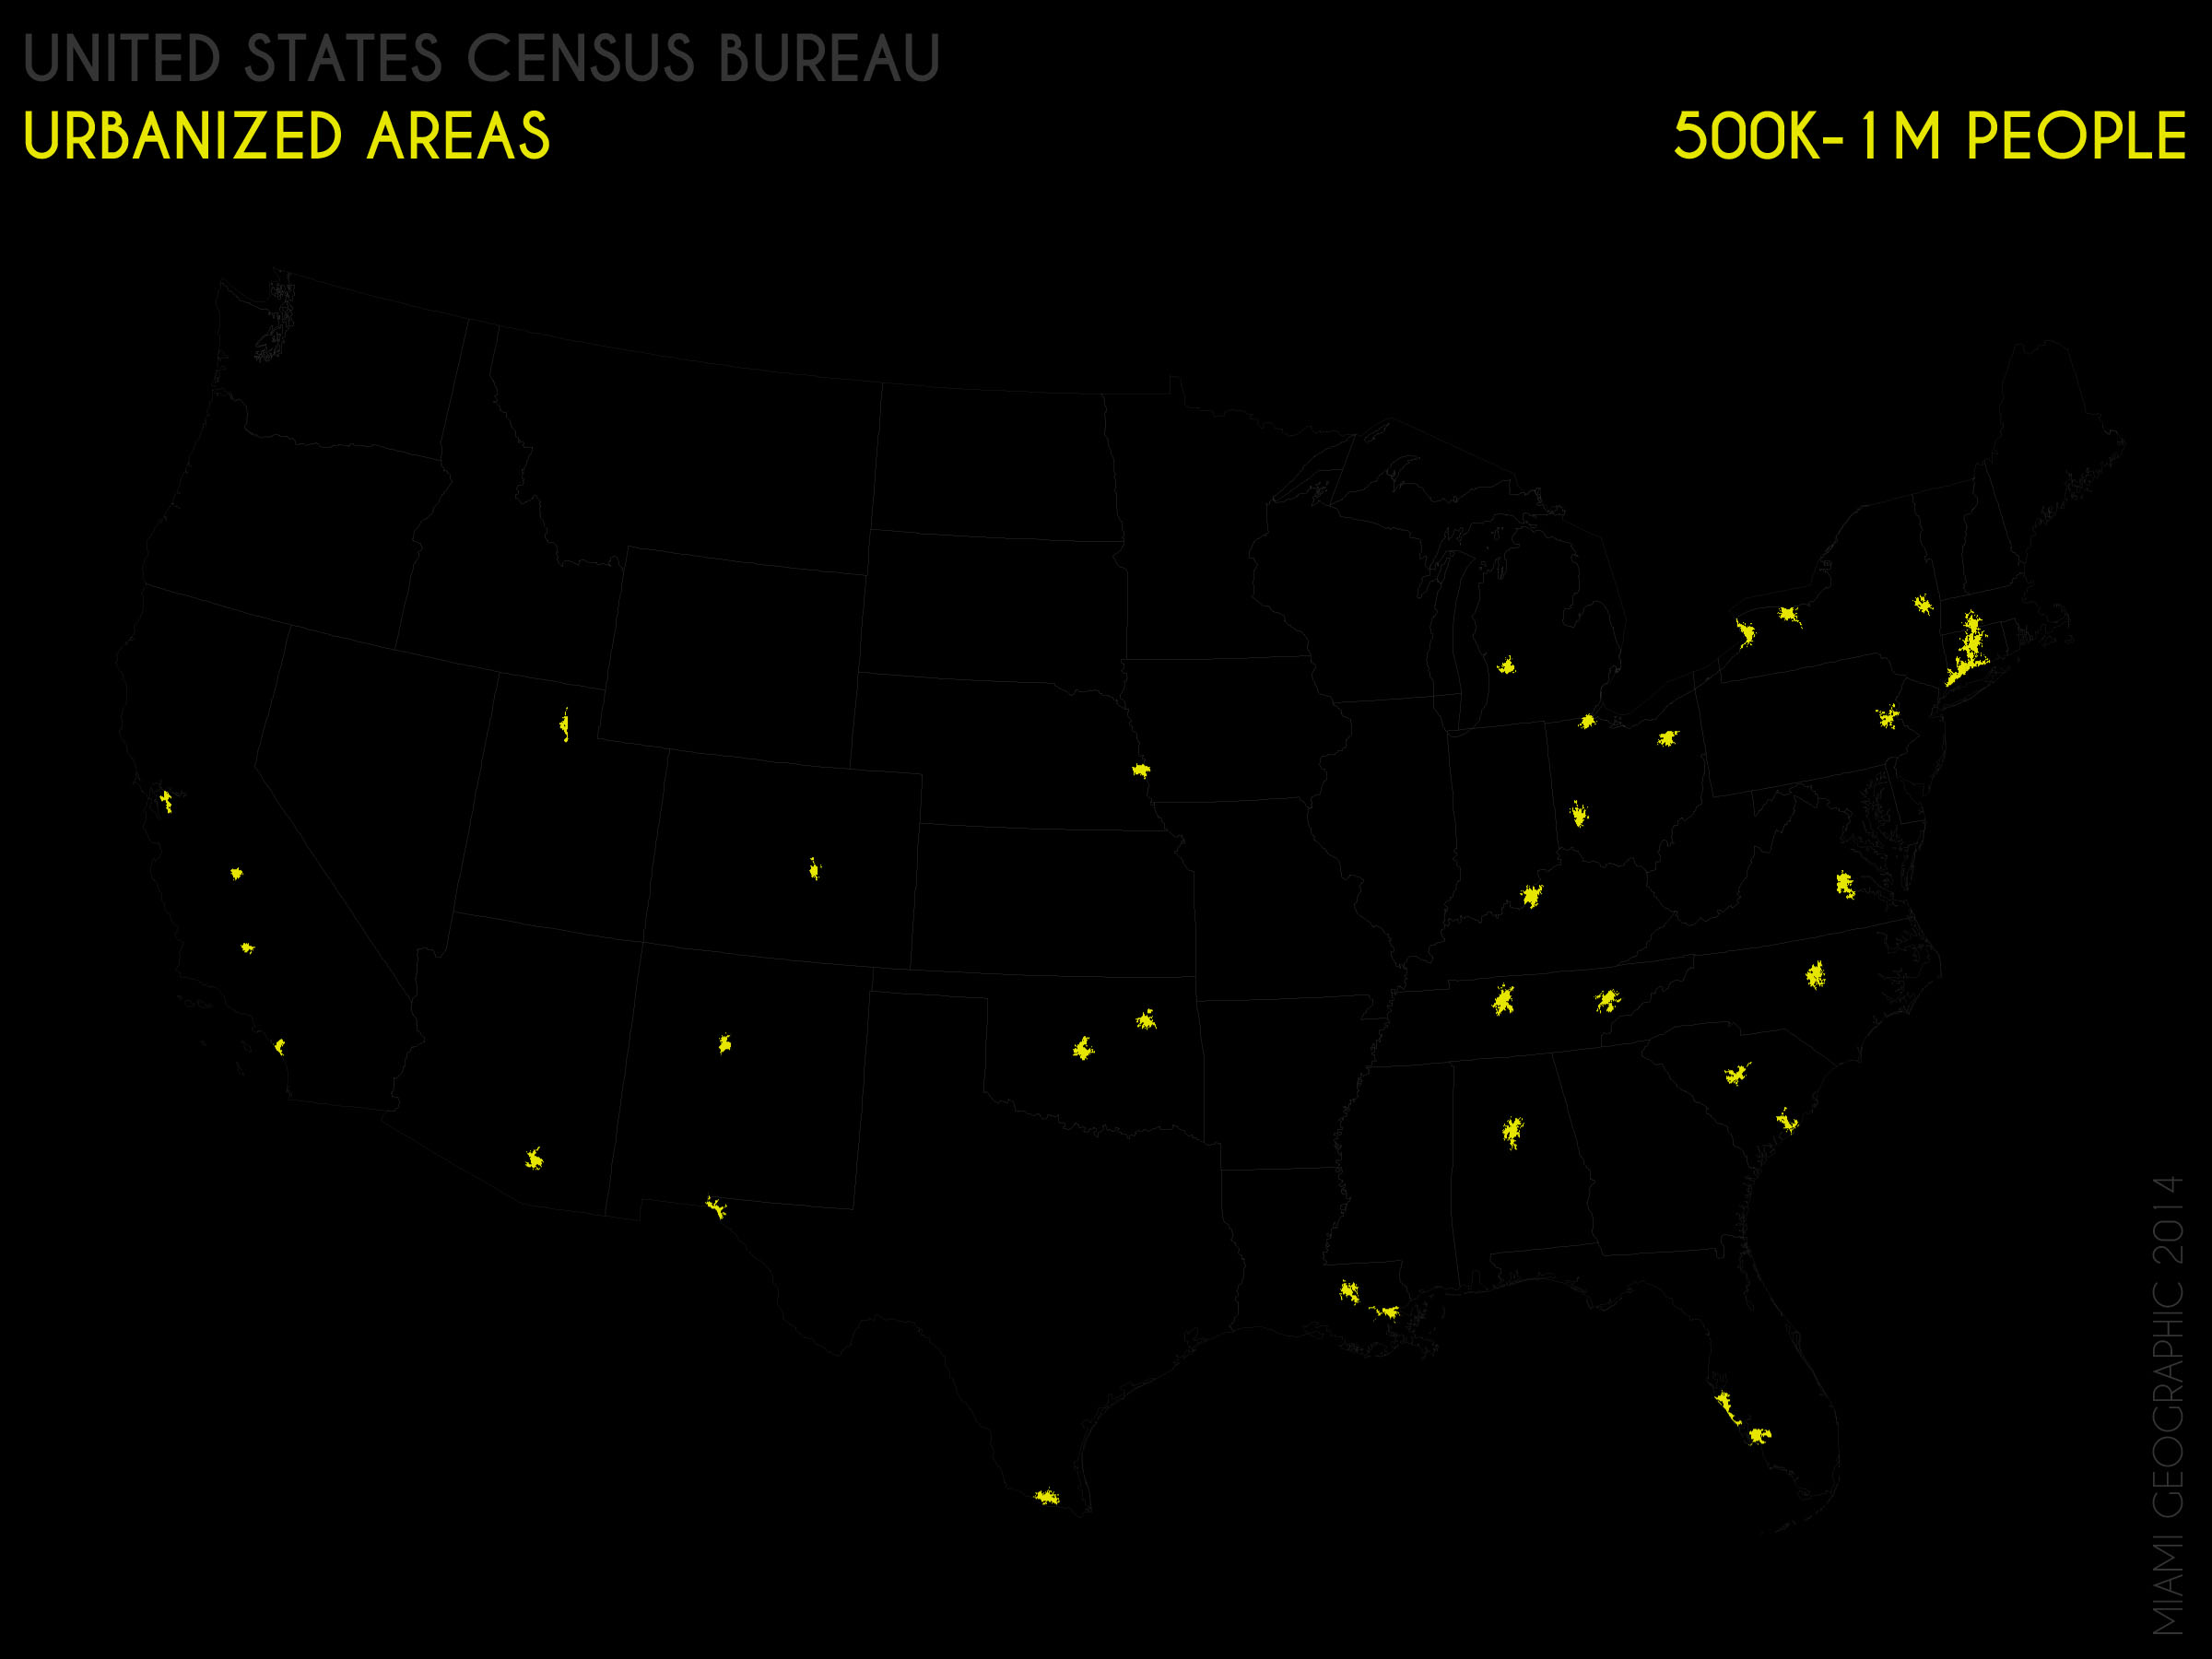
Urbanized Areas (500K-1M People), 2010. Data Source: US Census Bureau, 2010 Decennial Census. Map Source: Matthew Toro. 2014.
Twenty-one urban areas fall within the 1M – 2M class.
This category includes cities like Memphis, Tennessee (pop. 1,060,061); San Jose, California (pop.: 1,664,496); Sacramento, California (pop.: 1,723,634); Portland, Oregon (pop.: 1,849,898); and Las Vegas, Neveda (1,886,011).
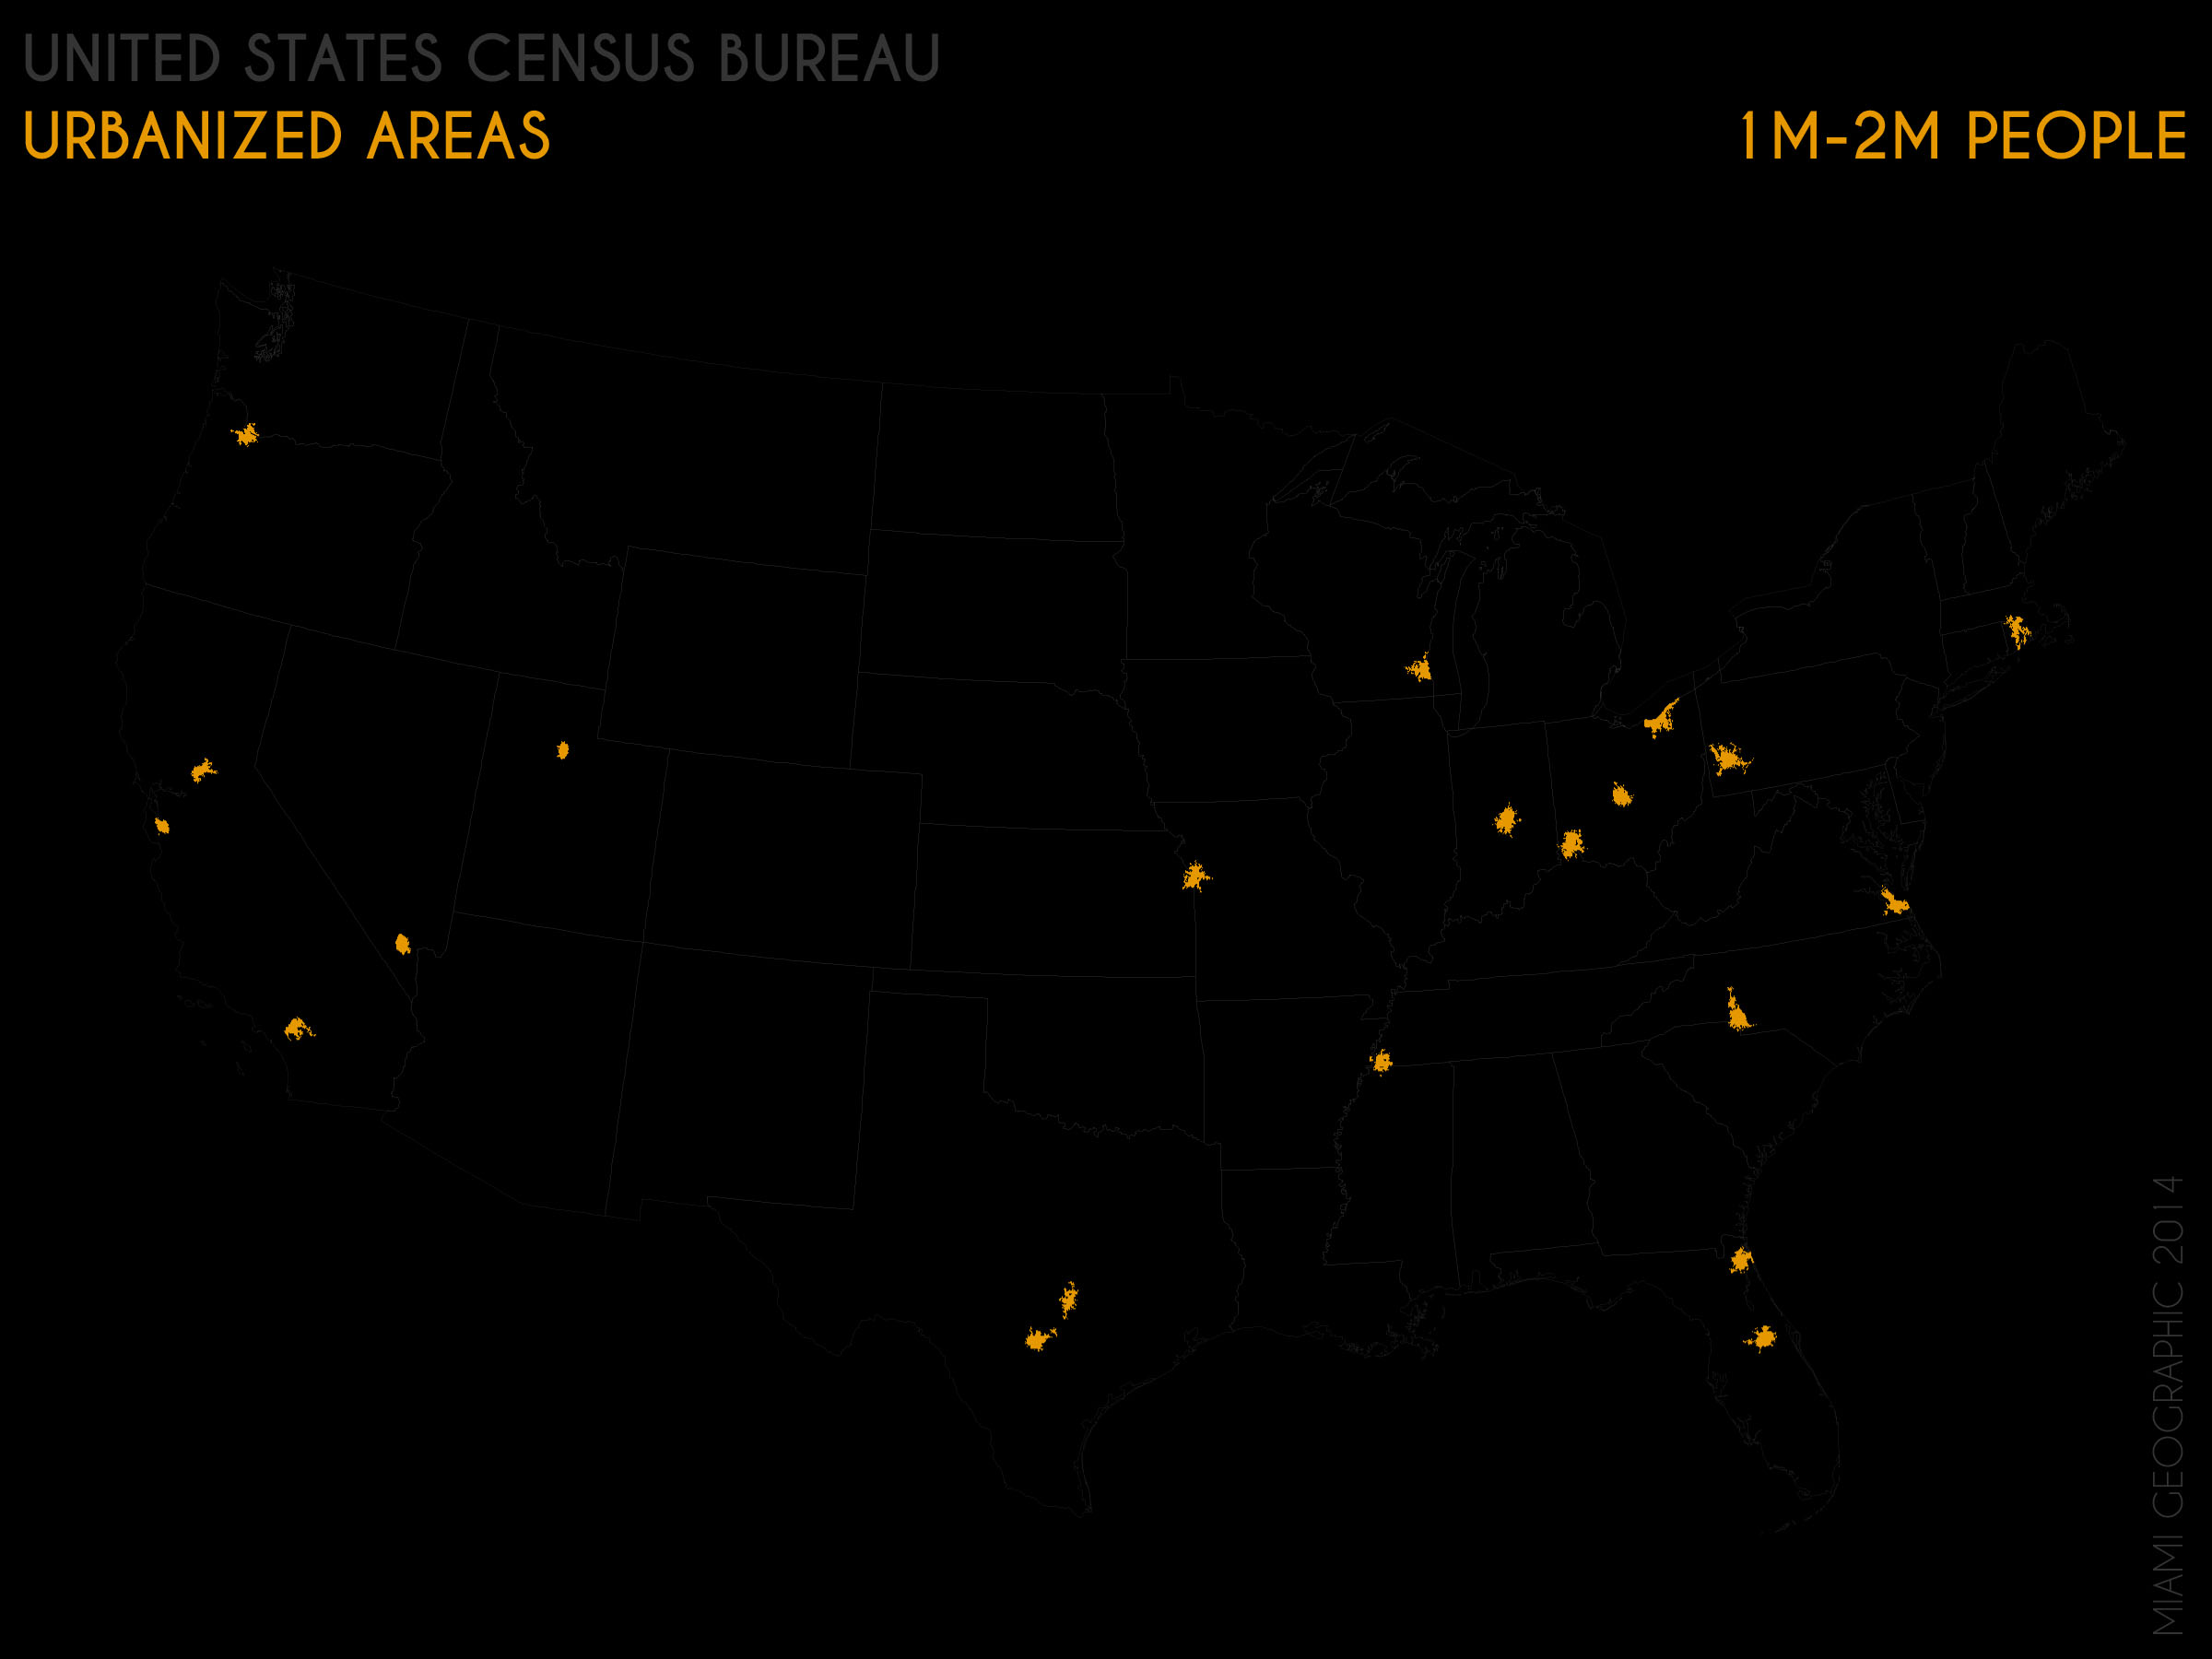
Urbanized Areas (1M-2M People), 2010. Data Source: US Census Bureau, 2010 Decennial Census. Map Source: Matthew Toro. 2014.
Seven cities fall into the 2M – 3M population category.
A few examples are: Baltimore, Maryland (pop.: 2,203,663); Denver, Colorado (pop.: 2,374203); and the Twin Cities of Minneapolis and St. Paul, Minnesota (pop.: 2,650,890).
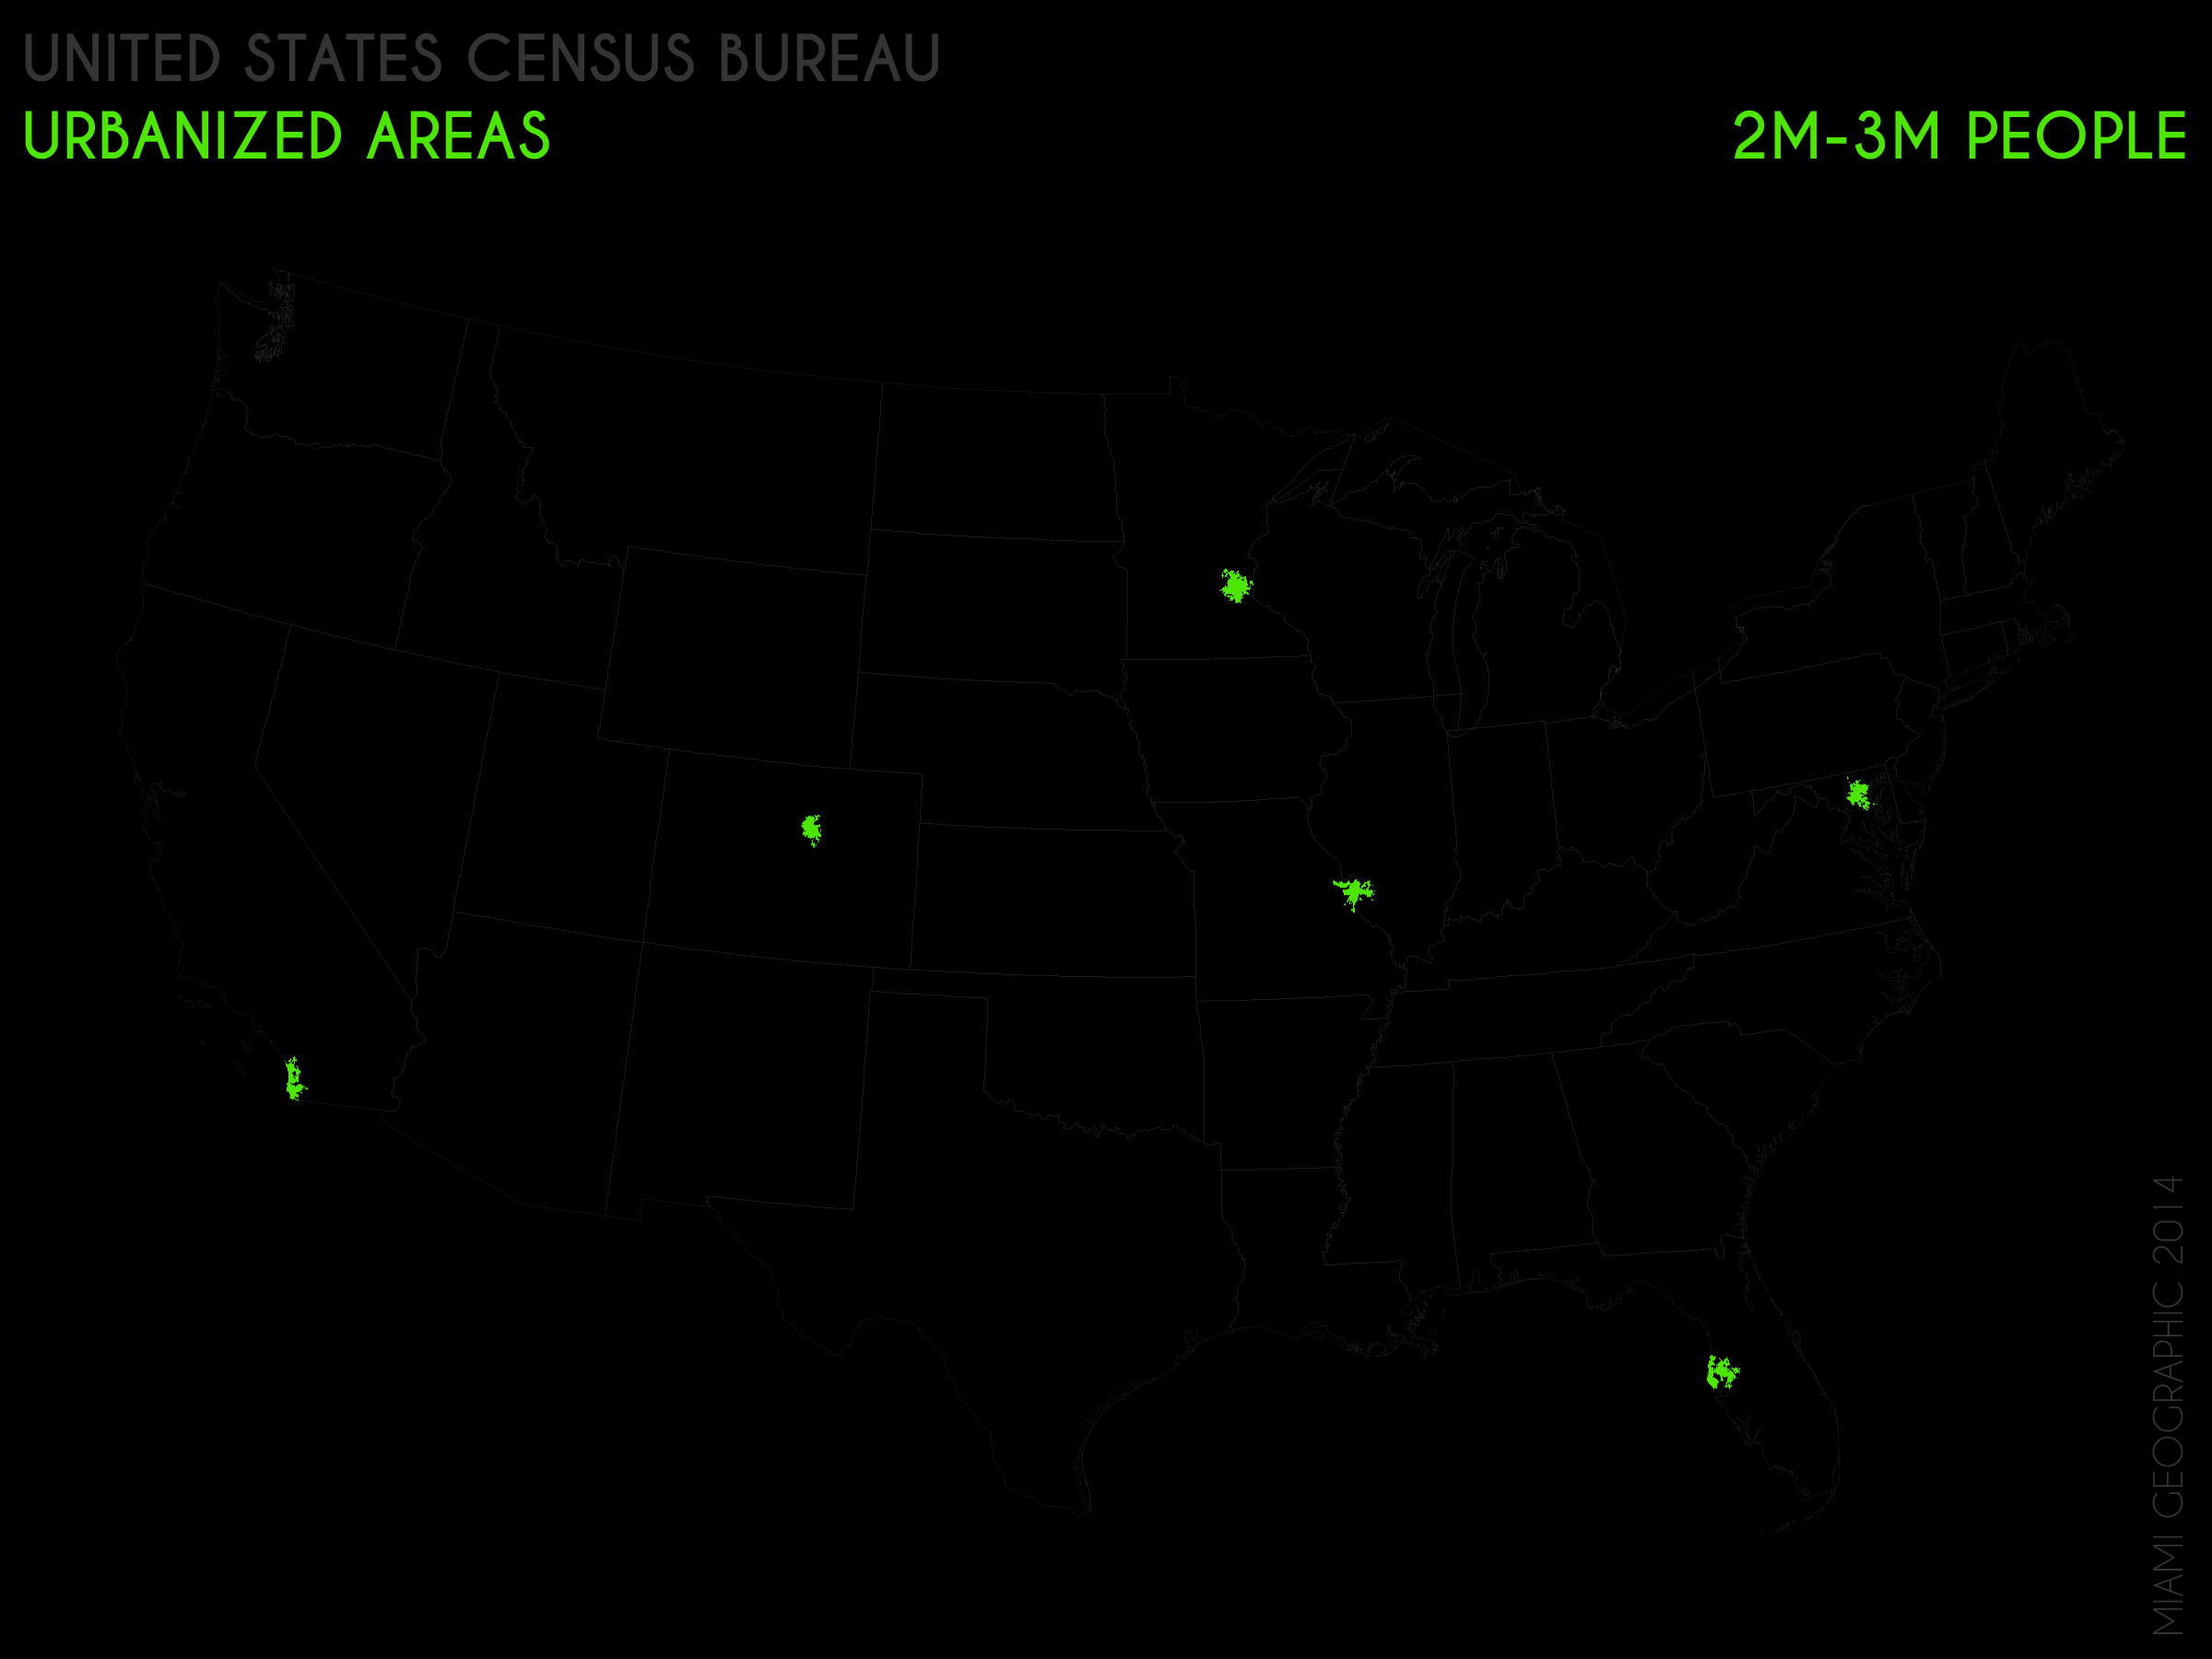
Urbanized Areas (2M-3M People), 2010. Data Source: US Census Bureau, 2010 Decennial Census. Map Source: Matthew Toro. 2014.
There are eight cities with populations in the 3M – 5M range.
Some of these blue stars include Seattle, Washington (pop.: 3,059,393); San Francisco, California (pop.: 3,281,212); Detroit, Michigan (pop.: 3,734,090); and Houston, Texas (pop.: 4,944,332).
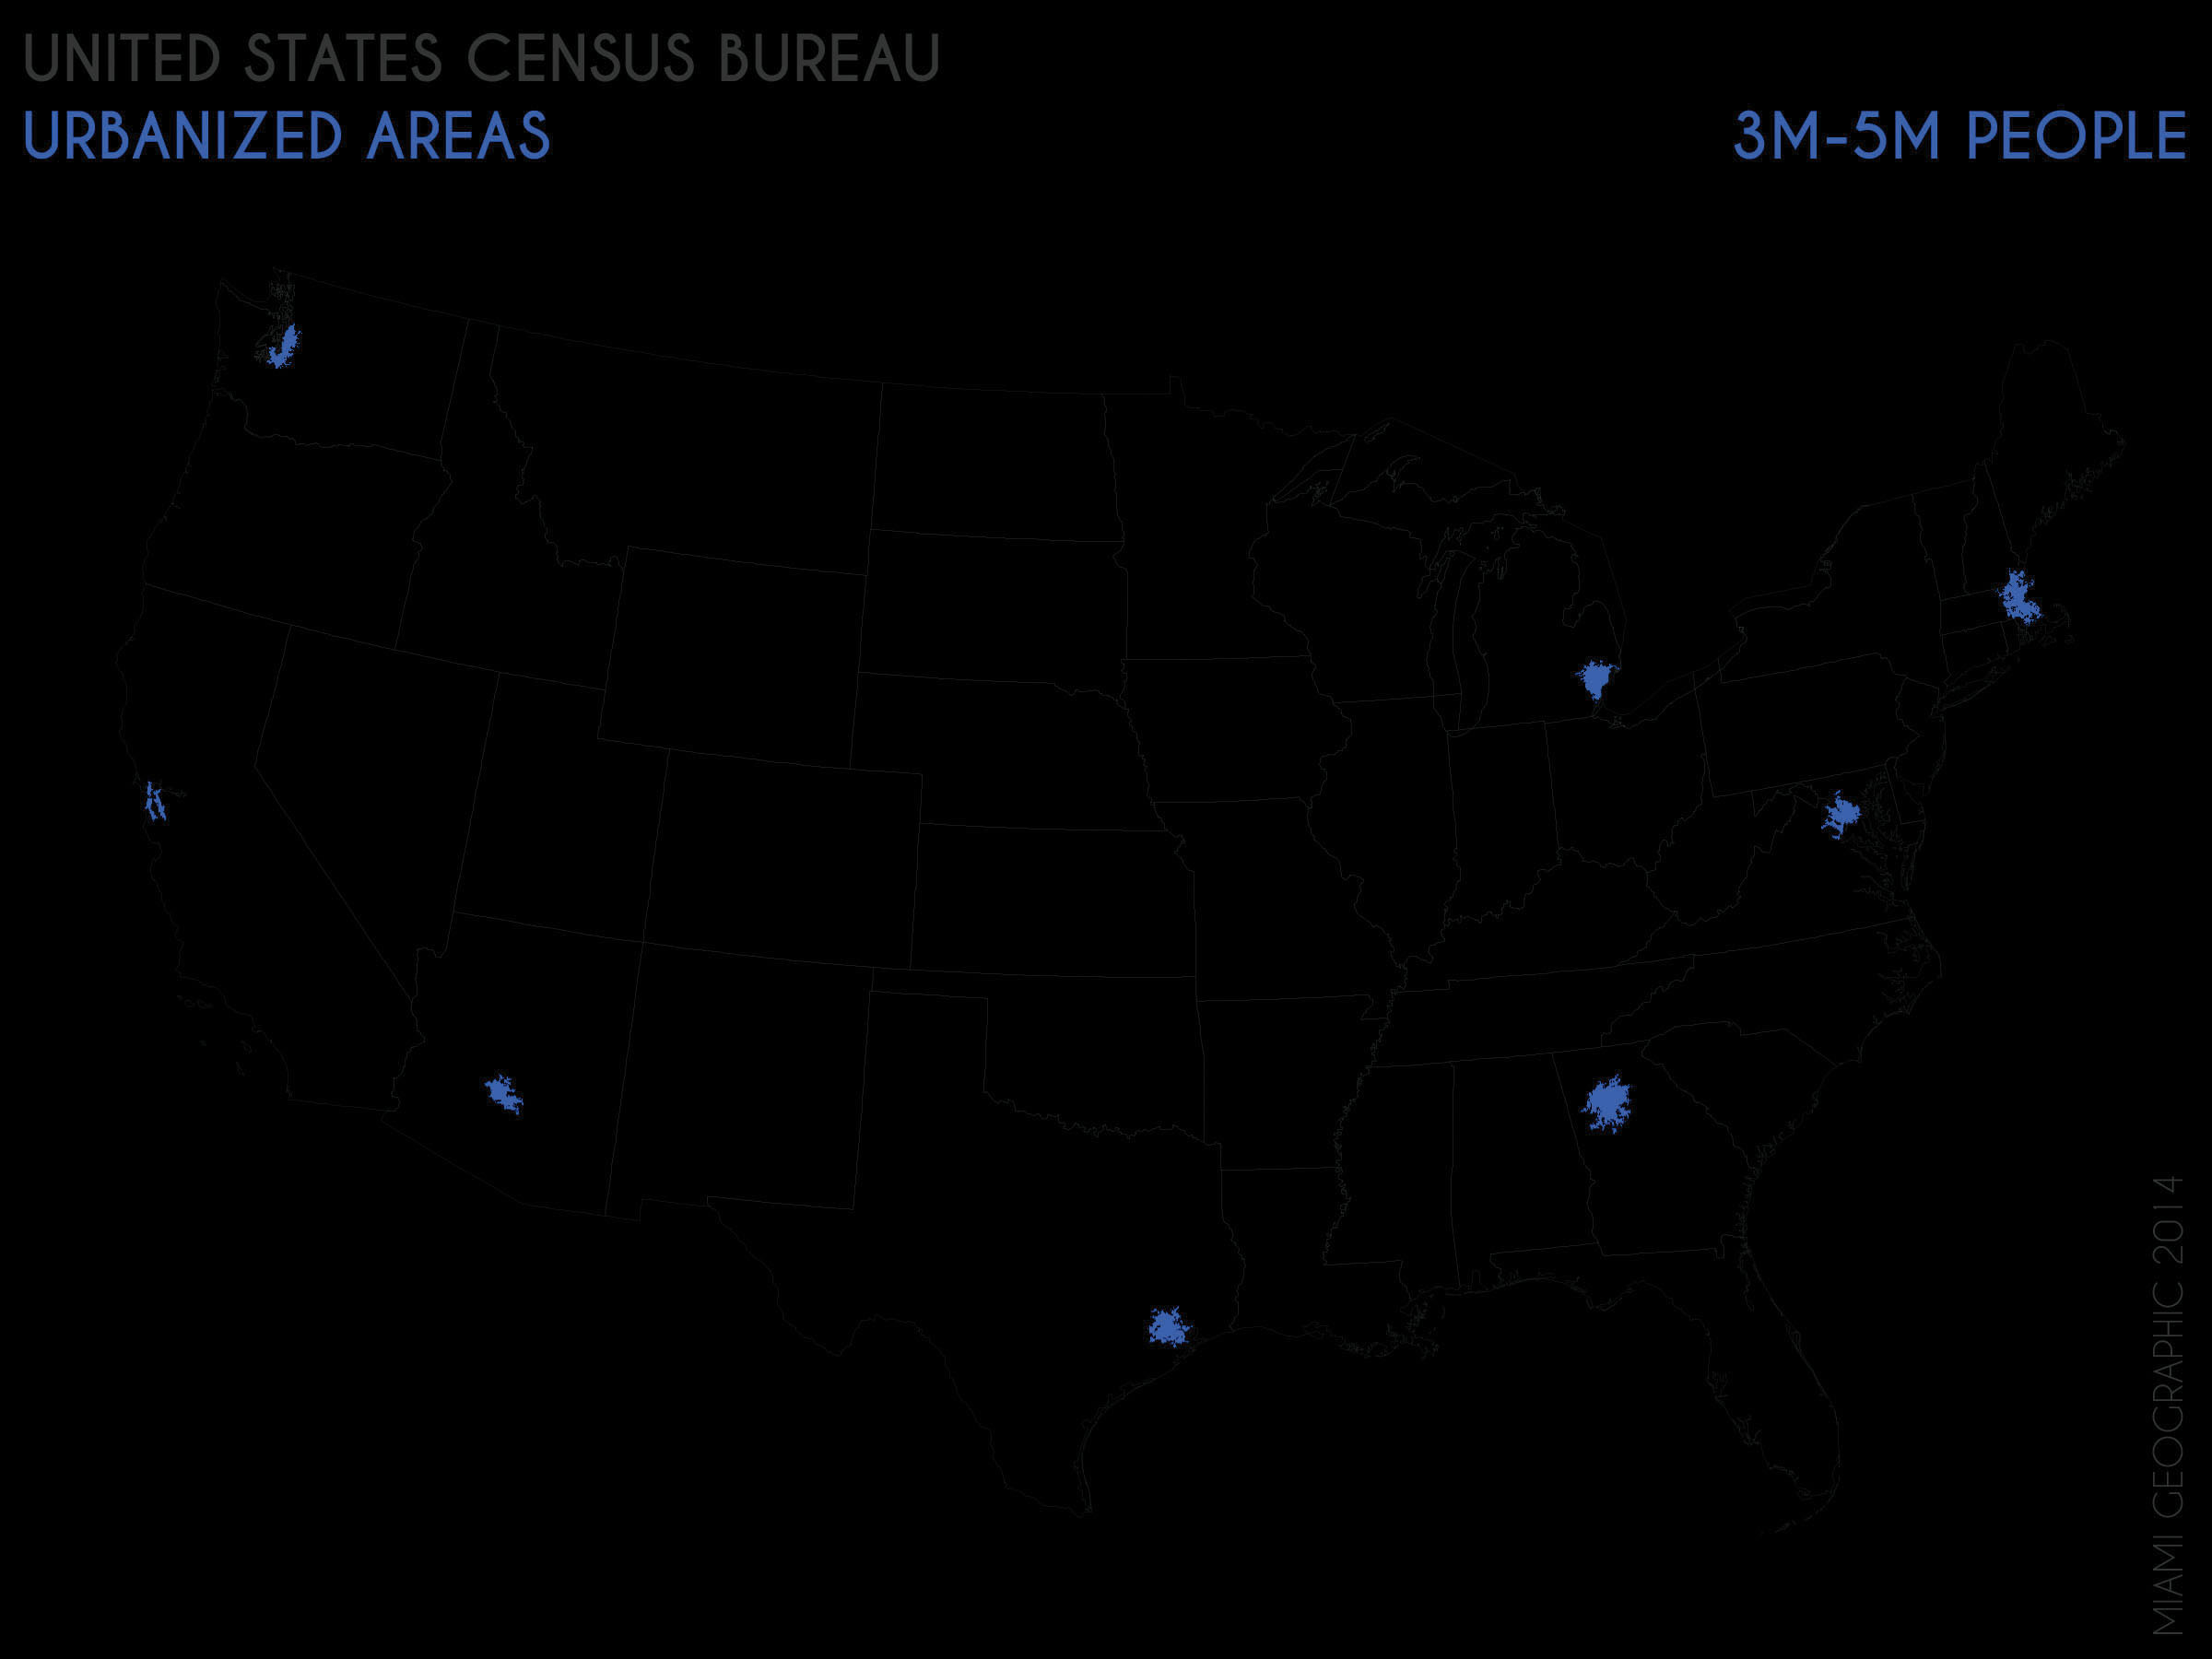
Urbanized Areas (3M-5M People), 2010. Data Source: US Census Bureau, 2010 Decennial Census. Map Source: Matthew Toro. 2014.
In the 5M – 10M range is where we finally find the Miami urbanized area (pop.: 5,502,379), which goes far beyond the City of Miami proper and includes the entire urbanized region growing out of Fort Lauderdale and West Palm Beach too.
In Miami’s company are only three other urban areas: Dallas / Fort Worth / Arlington, Texas (pop.: 5,121,892); Philadelphia, Pennsylvania (pop.: 5,441,567); and Chicago, Illinois (pop.: 8,608,2078).

Urbanized Areas (5M-10M People), 2010. Data Source: US Census Bureau, 2010 Decennial Census. Map Source: Matthew Toro. 2014.
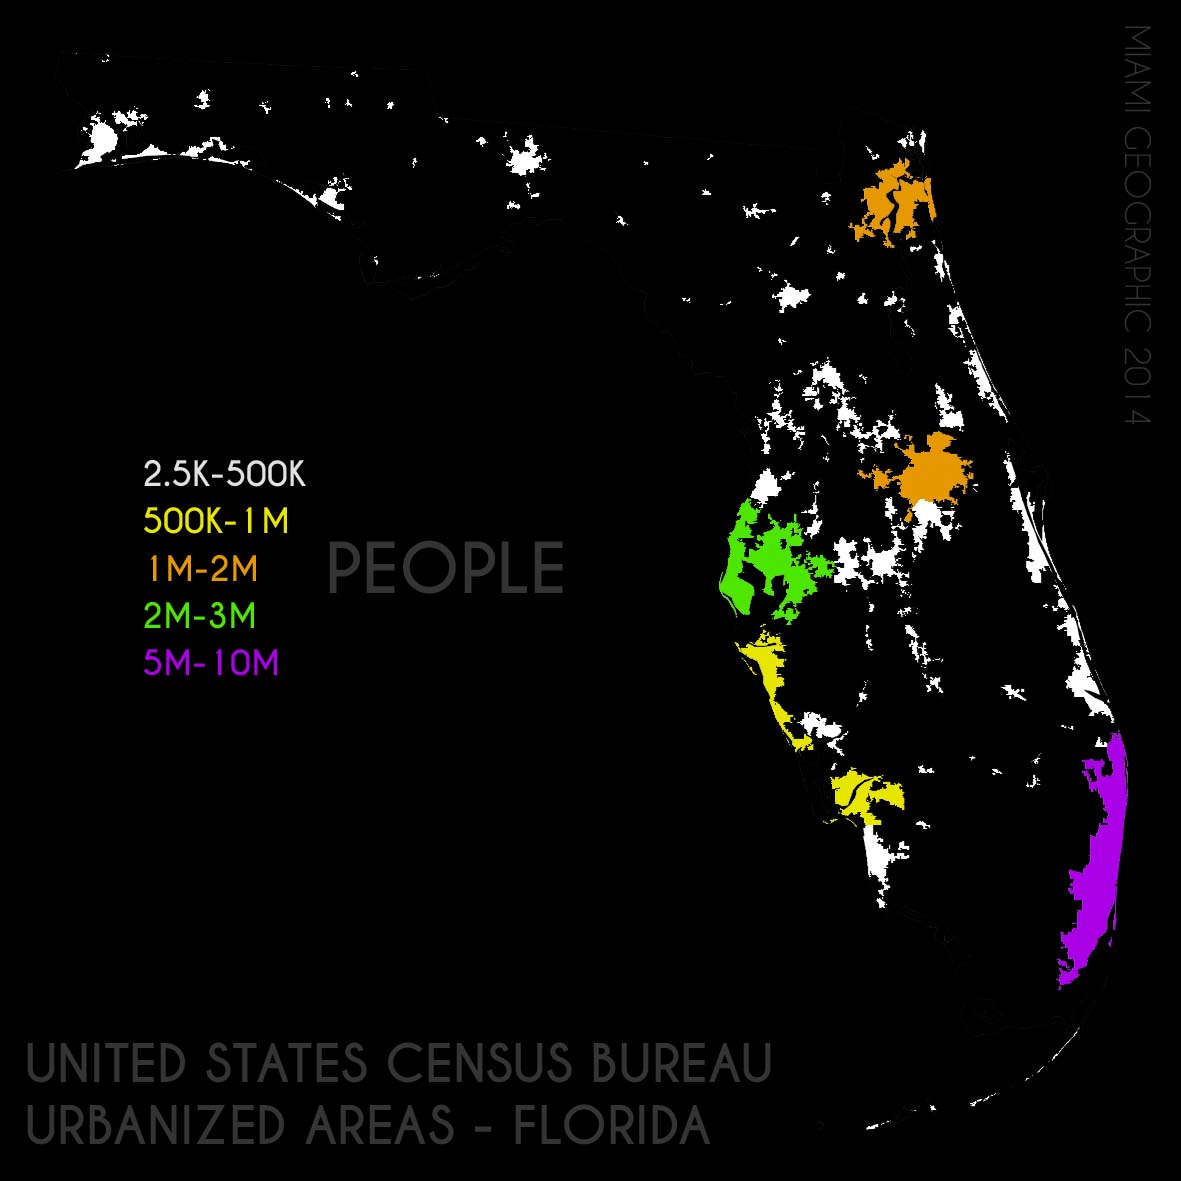
Florida Urbanized Areas Stratified, 2010. Data Source: US Census Bureau, 2010 Decennial Census. Map Source: Matthew Toro. 2014.
We find the United States’ largest two cities in the > 10M range: the New York-based megalopolis (pop.: 18,351,295) and its west coast counterpart centered on Los Angeles (pop.: 12,150,996)
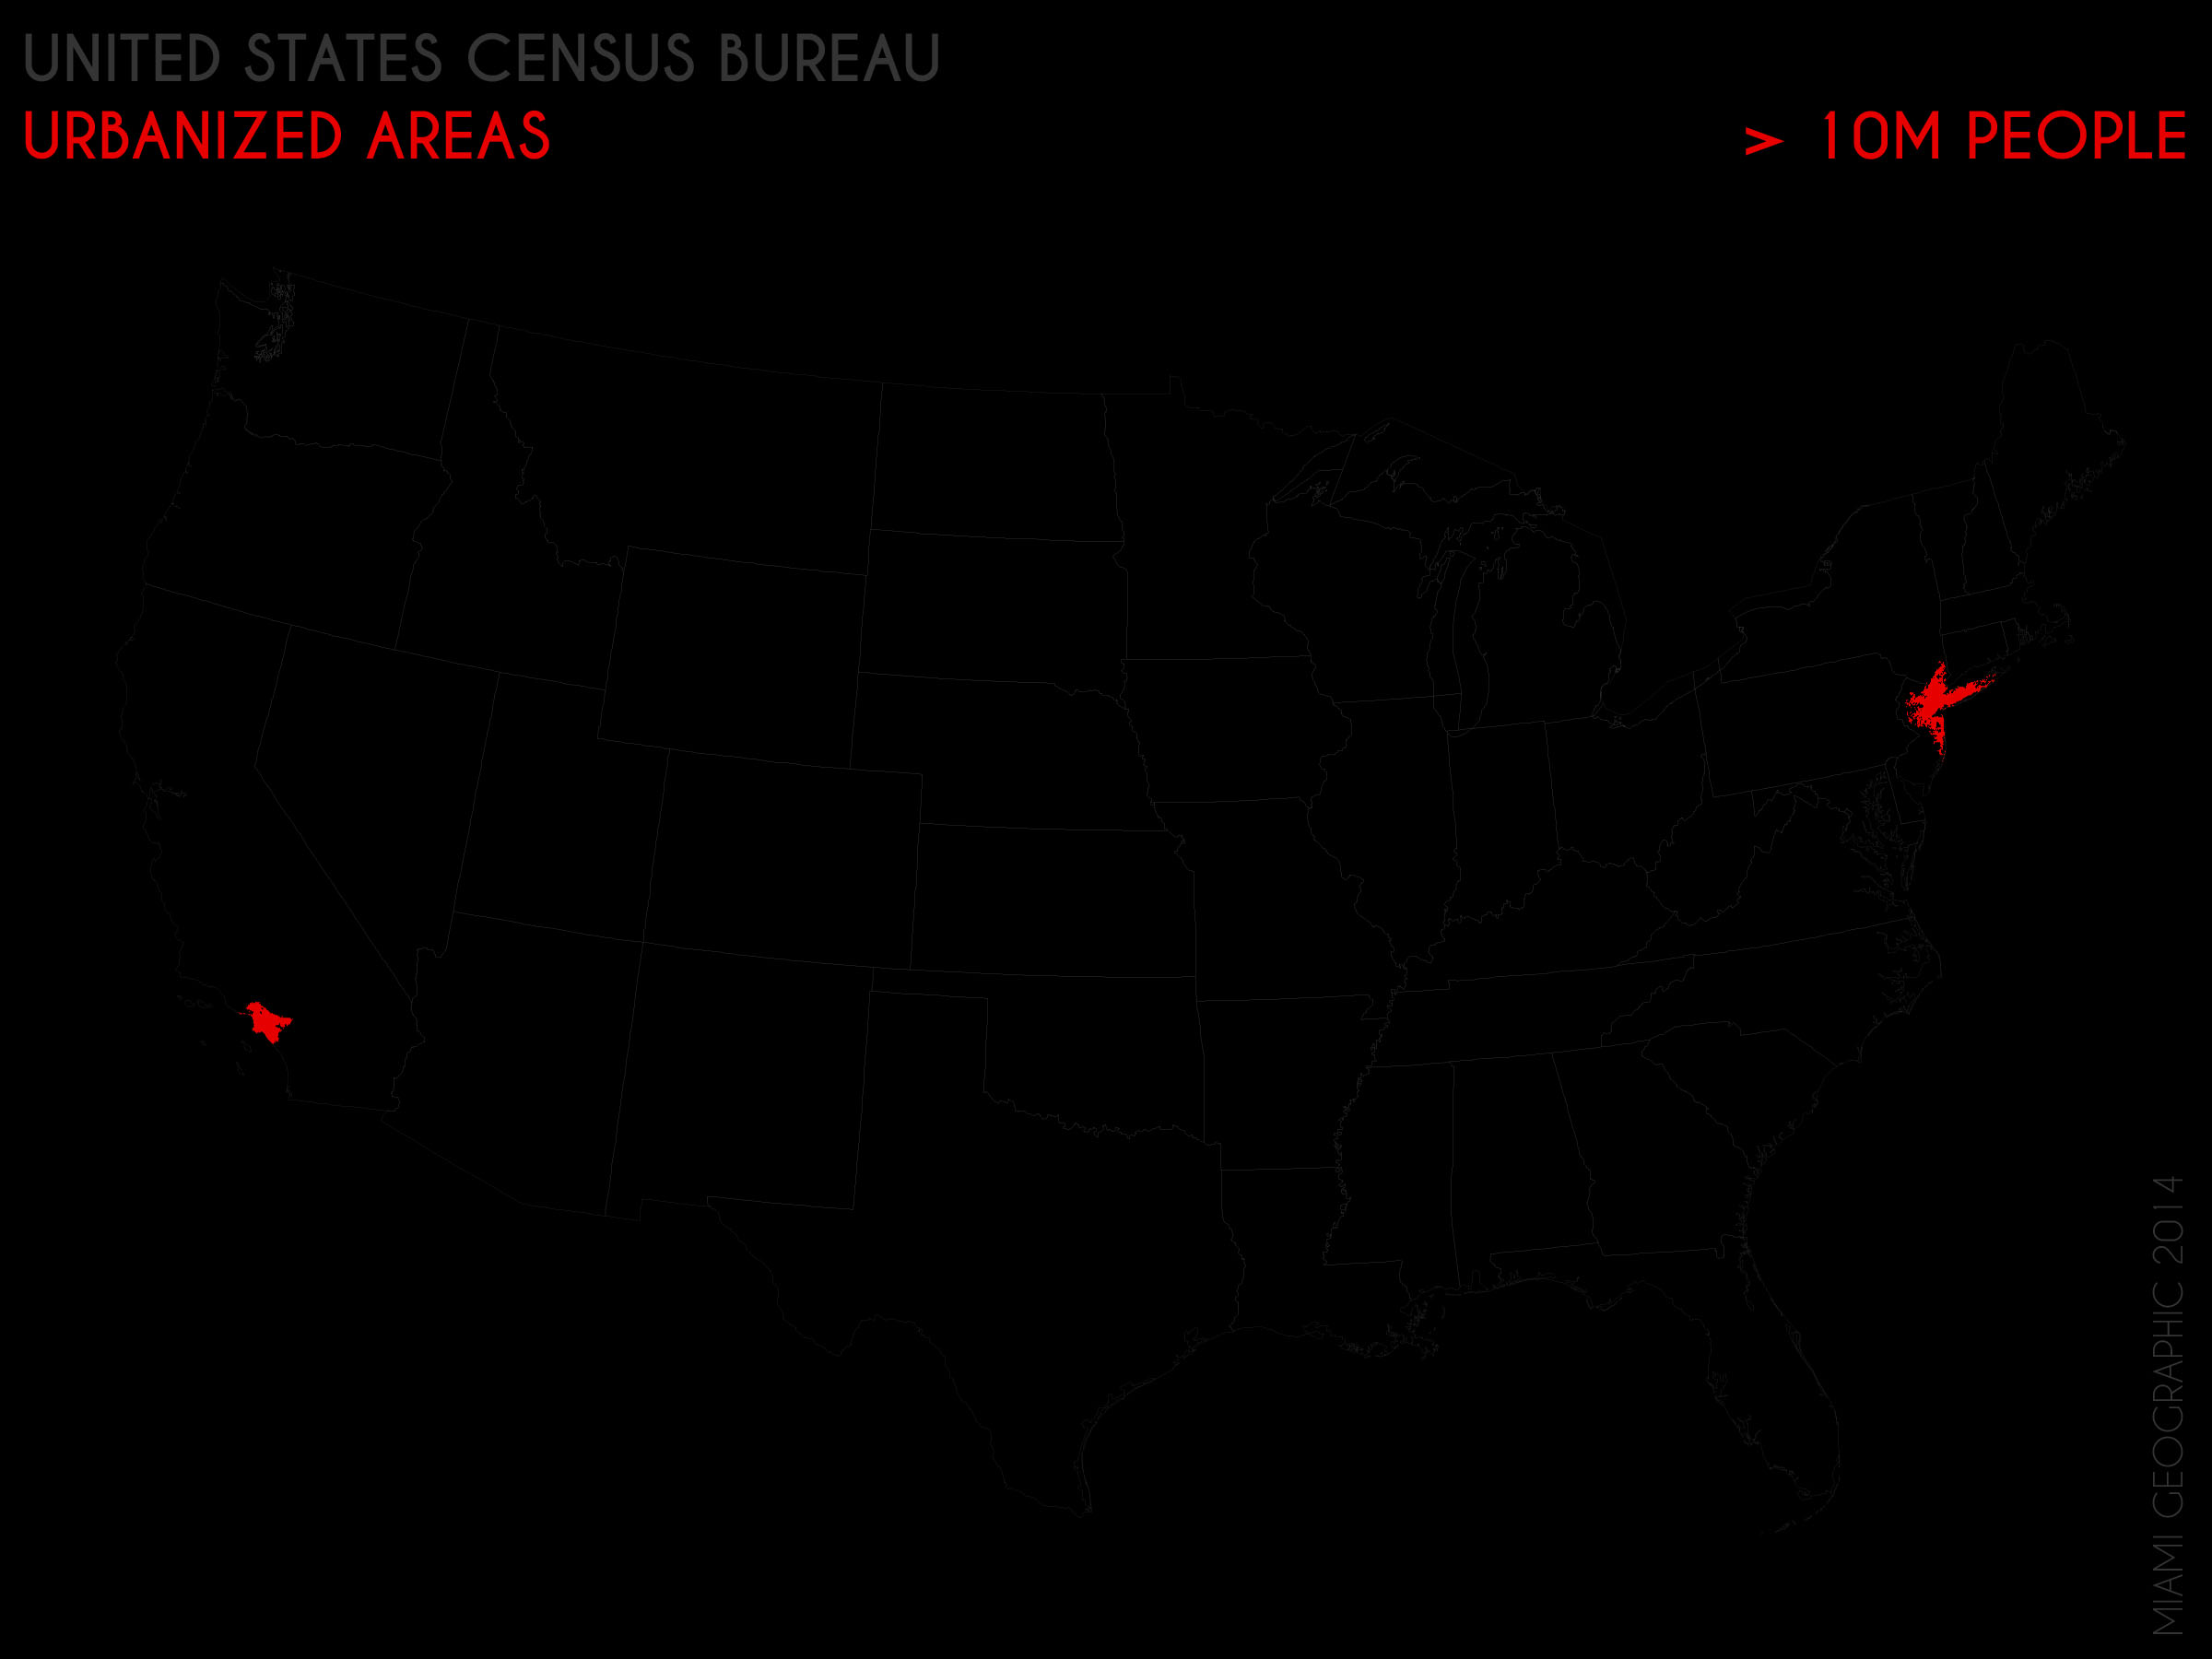
Urbanized Areas (>10M People), 2010. Data Source: US Census Bureau, 2010 Decennial Census. Map Source: Matthew Toro. 2014.
To really get the full urban population stargazing experience, though, it’s best when we let the United States’ urban system shine in its brilliant, population-stratified oneness.
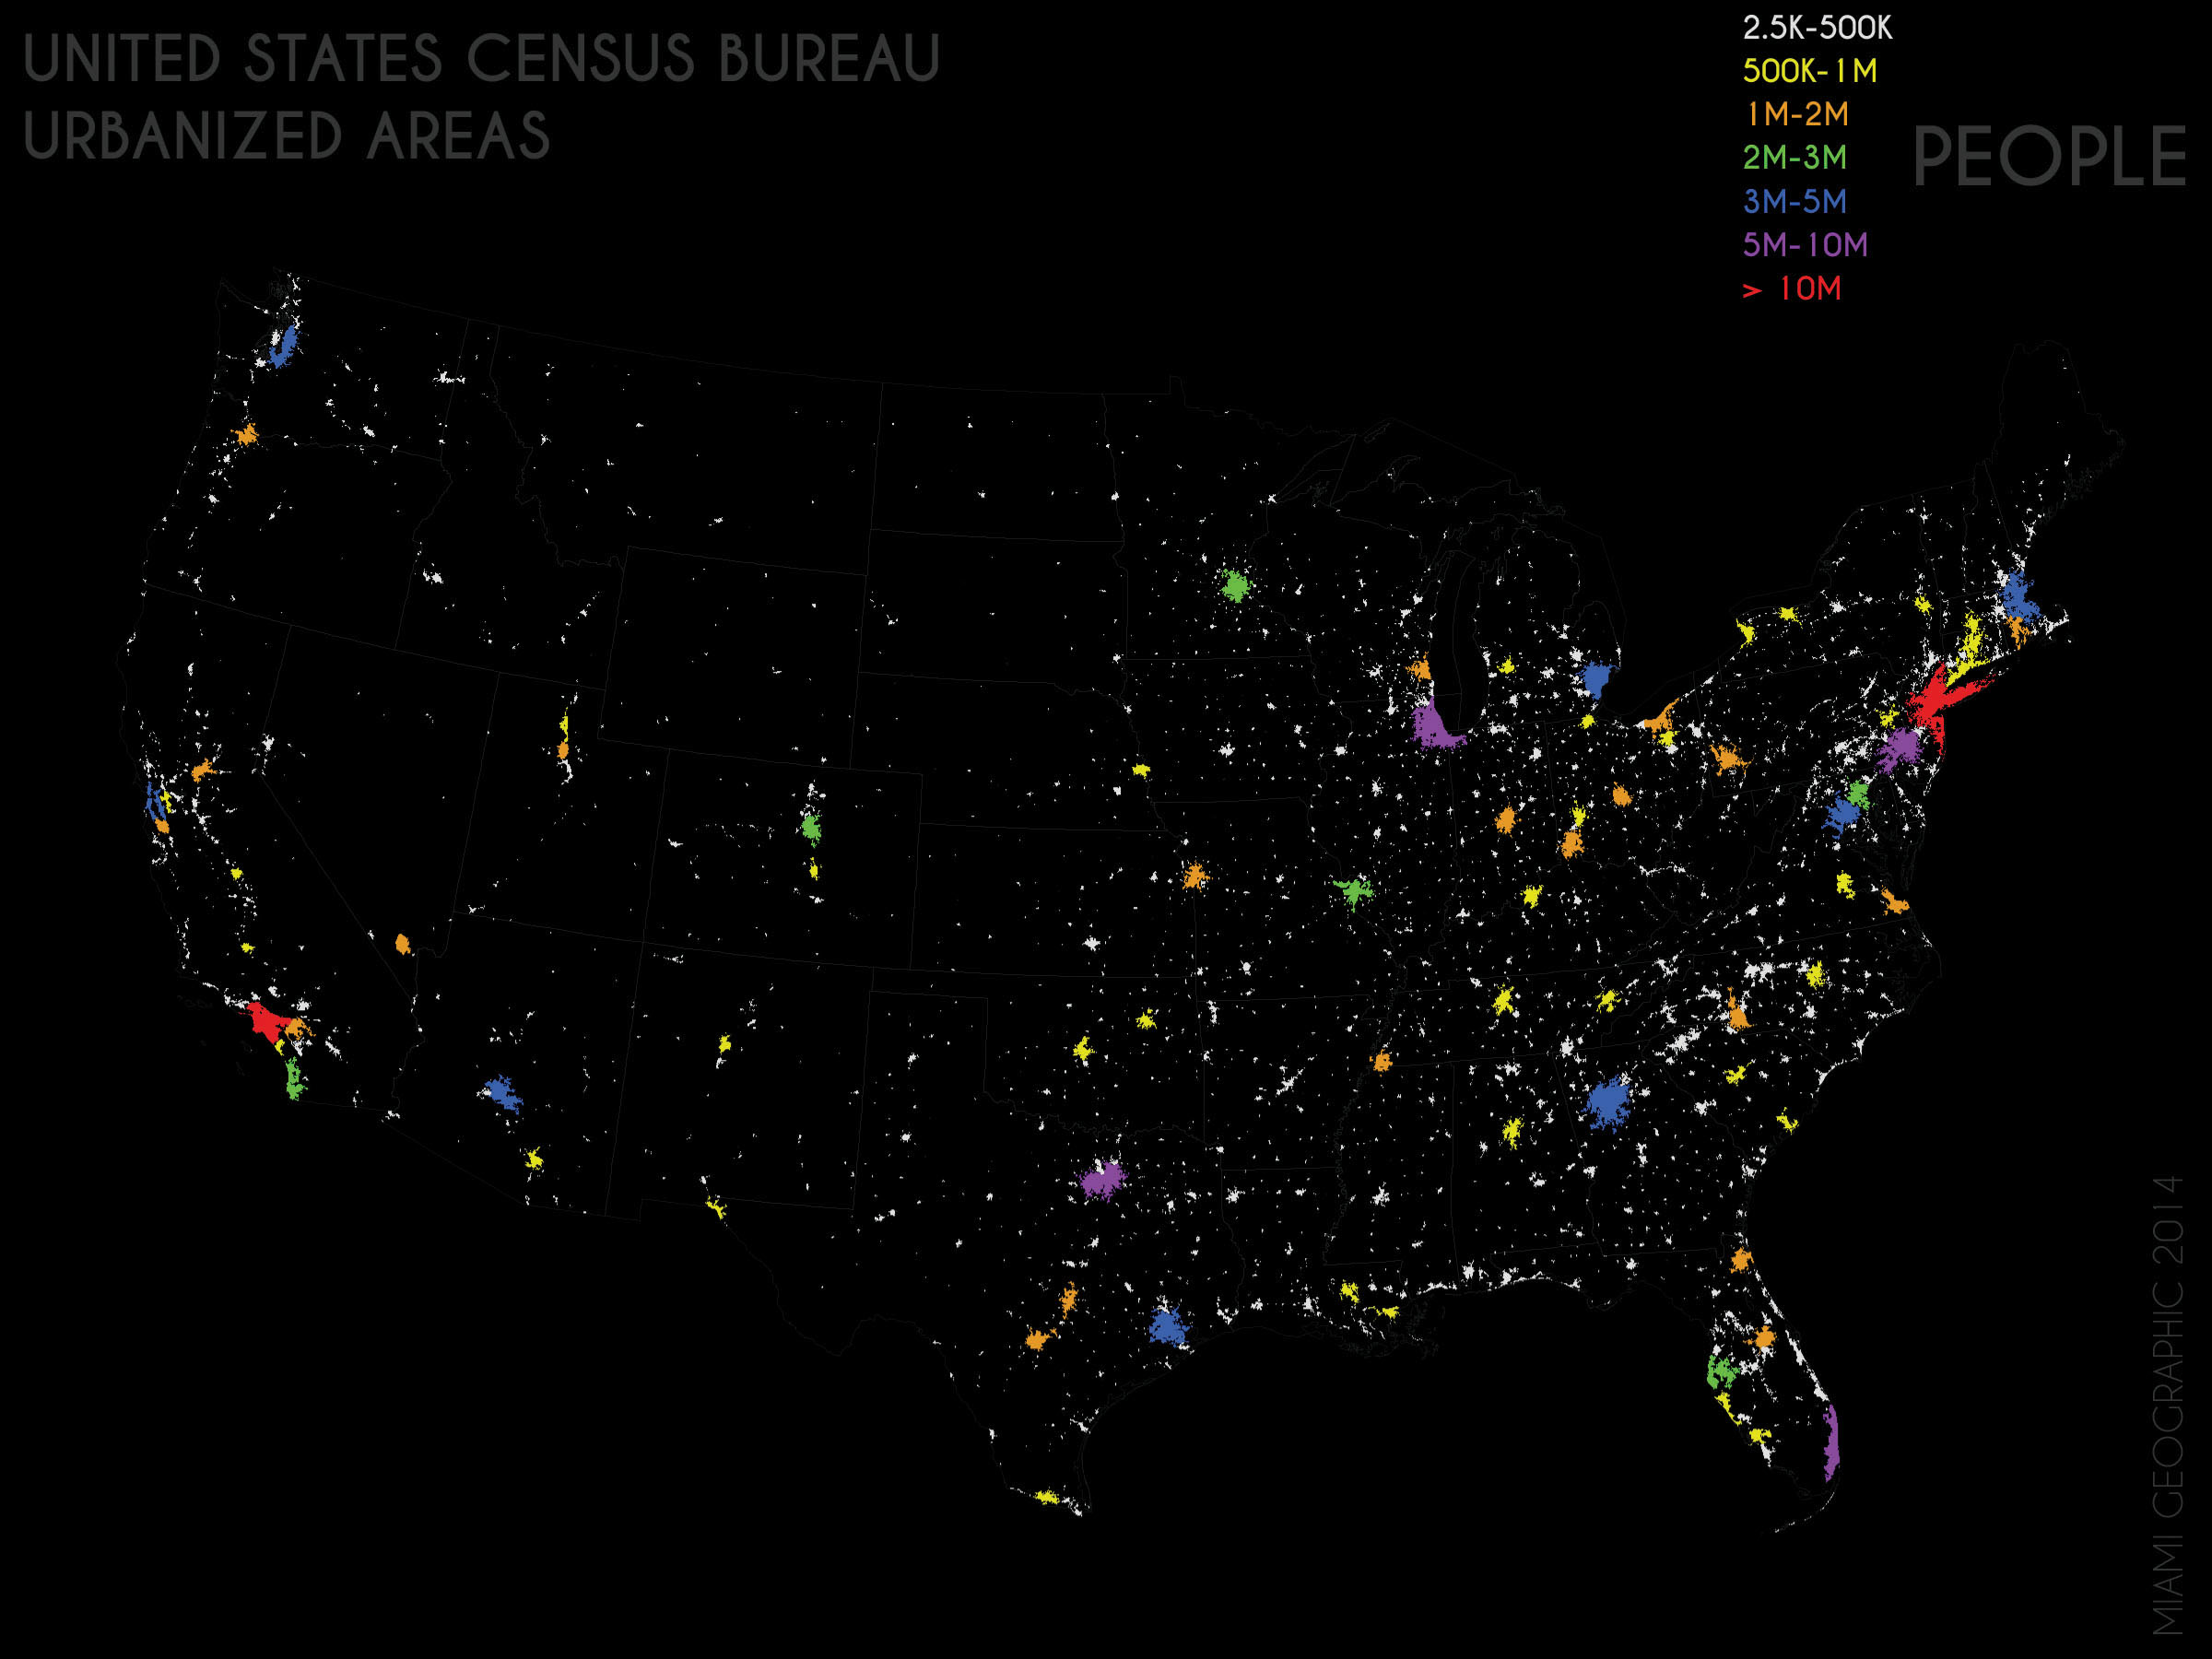
Urbanized Areas Stratified, 2010. Data Source: US Census Bureau, 2010 Decennial Census. Map Source: Matthew Toro. 2014.